Soil Profile Plots
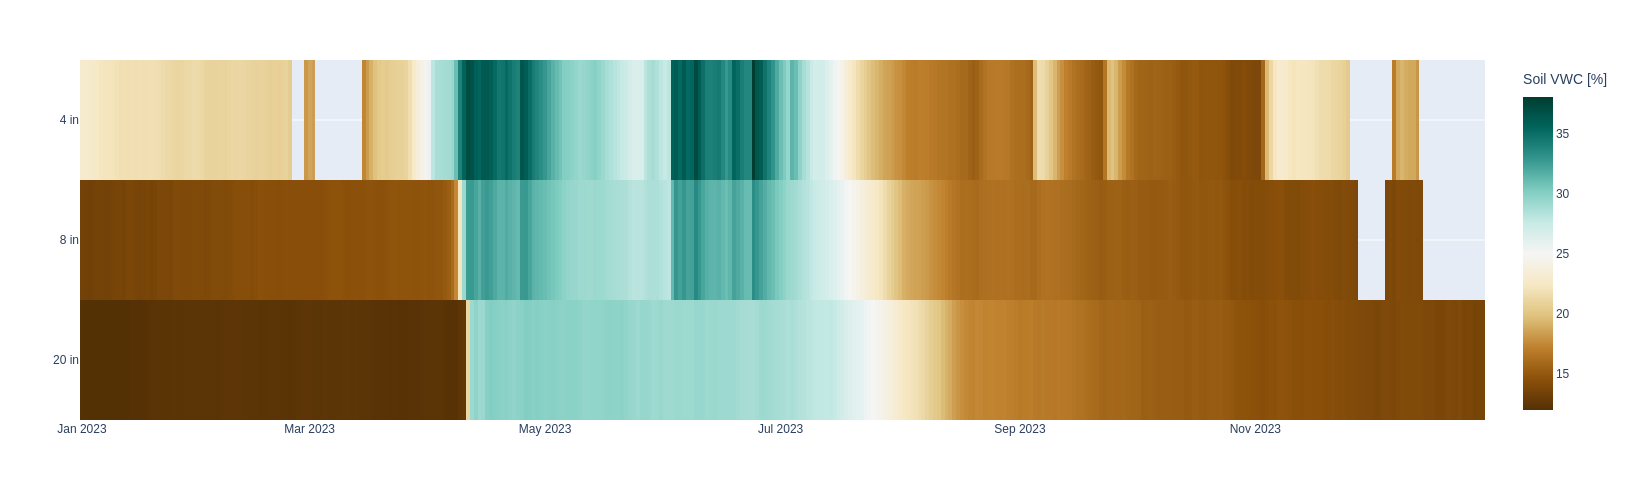
The soil profile plots available on the dashboard show soil moisture (VWC), temperature, electrical conductivity, and soil water potential as a function of depth. For example, in the plot below, VWC for all of 2023 is plotted at the Bozeman HydroMet station. The bluer colors represent wetter conditions, while the browner colors represent drier conditions. The figure shows that as winter snowpack starts to melt, VWC increases, reaching as far as 20 inches beneath the surface. As summer begins, the three soil layers begin to dry out. Uncolored cells represent periods of time when the soil is frozen.