The Montana Climate Office has recently developed climate normals for the 1991 - 2020 record. Read more about climate normals below and access the data under the Climate Normals section.
What are Climate Normals?
Climate normals are 30-year summaries of climate data that are generated each decade. Normals provide a broad overview of average climate conditions over the past 30 years. To create the normals, historical data from the past three decades are summarized across different timescales (e.g., months, seasons, or years) using common metrics such as the mean or median. These normals help contextualize current conditions from the perspective of the past few decades.
While normals are extremely useful for contextualizing current conditions, a downfall is that they don’t give any insight into how likely or unlikely a given event is. For example, if a rancher asked “what is the probability that I get at least four inches of rain this summer?” or “I got 15 inches of rain this year. What are the odds of that?”, a mean or median doesn’t help answer the question. Additionally,conventional normals like the mean or median don’t tell us anything about the underlying structure of the data. Ideally, a climate normal should both convey average conditions and allow for further investigation into the underlying data. This finer-level detail is possible by using a gamma distribution to summarize historical data. In the following sections, we explain what a gamma distribution is and how we used the gamma distribution to create Montana’s climate normals for the 1991 - 2020 period of record.
What is the Gamma Distribution?
A gamma distribution is a continuous function that is defined by two parameters, alpha and beta. When fitting a gamma distribution to a set of data (x), alpha and beta are chosen such that when a value from x is passed into the gamma function, the resulting value is as close to the observed density of x on a probability density function as possible. For example, the figure below shows a histogram of simulated annual precipitation over a 30 year period with a gamma distribution fit to the data:
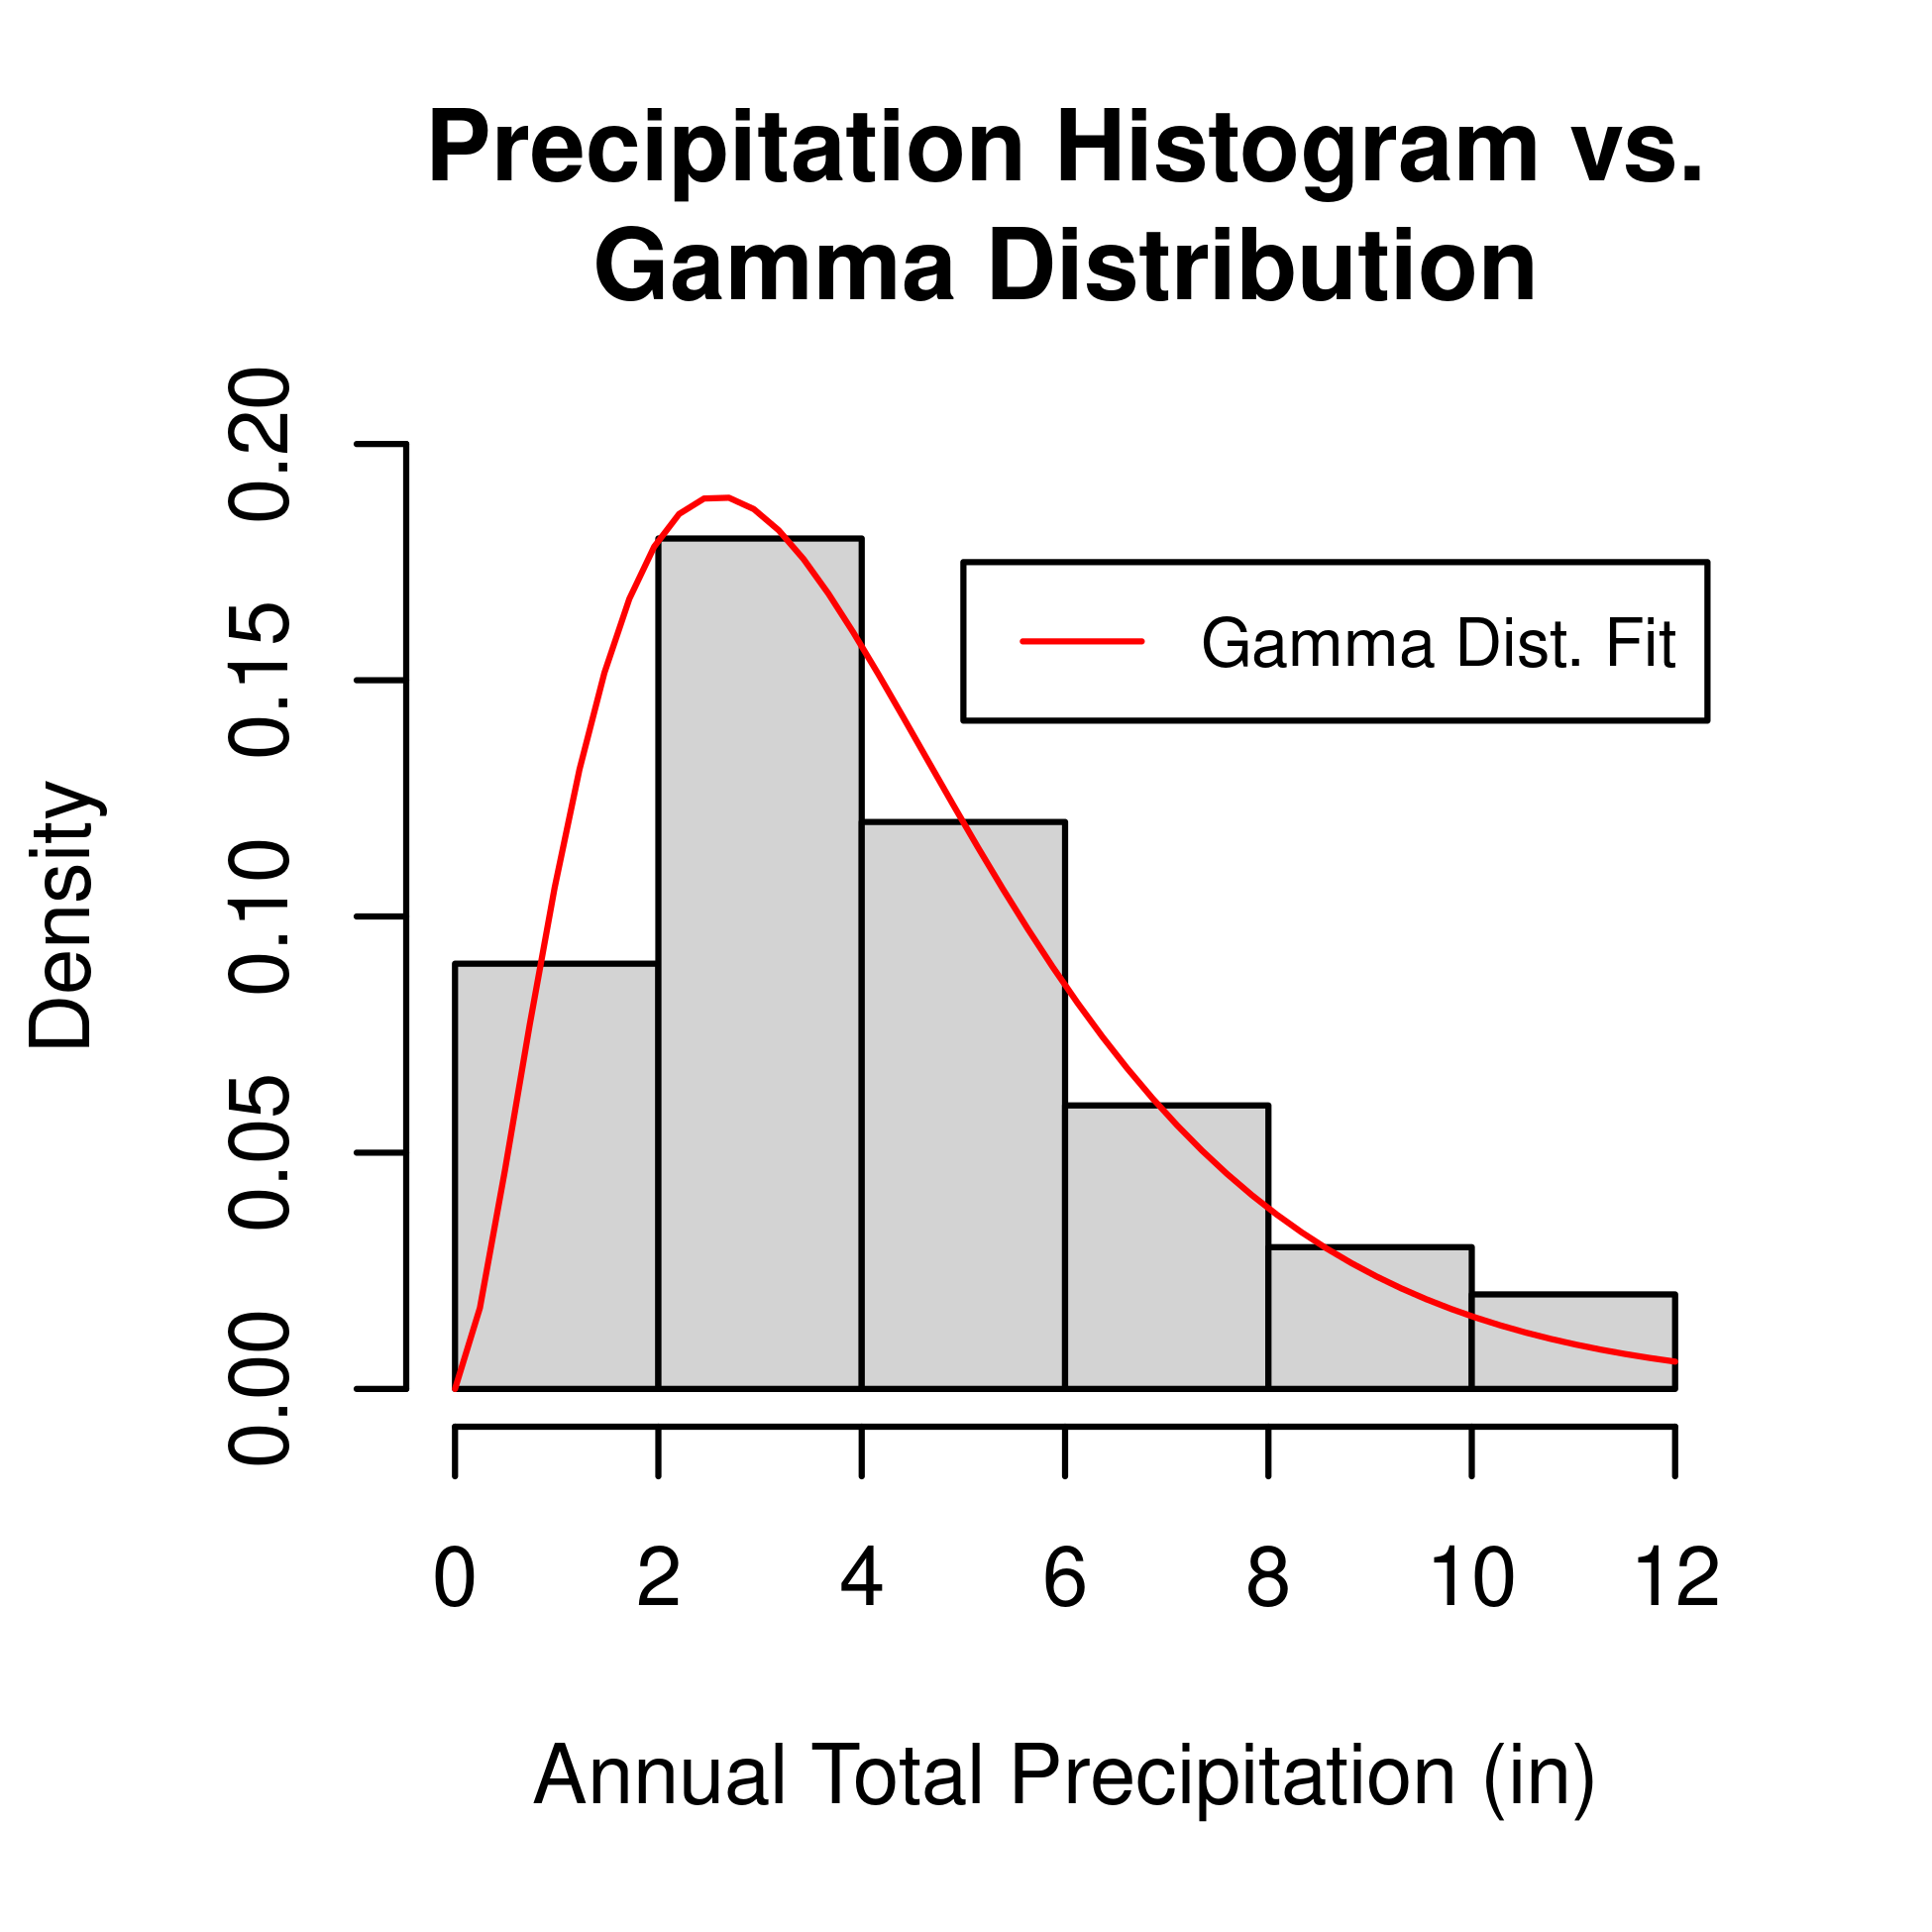
In this example, the gamma distribution fits the observed data pretty well. In fact, the gamma distribution can approximate any distribution of data so long as they are greater than zero and approximately normally distributed.
In the gamma distribution, the alpha parameter defines the shape of the distribution, or how spread out the curve is. The beta parameter defines the rate of distribution, or how rapidly the curve rises and falls. A convenient quality of the gamma distribution is that there are closed-form solutions to the underlying data’s mean, mode and variance that can be calculated using only alpha and beta. Additionally, other statistics like the median, IQR, and exceedance probabilities can easily be calculated by passing alpha, beta and a value from x into other relatively simple functions. This means that by fitting a gamma distribution to a set of data, we can completely encode the underlying structure of the data into the alphaand beta parameters. This not only cuts down on storage space, but also allows for deeper investigation into the datasets than only deriving the traditional normals of mean, median, etc. Because of this convenience, we used gridMET meteorology to derive gamma distribution climate normals across Montana for the 1991 - 2020 period.
Montana’s Climate Normals
To create Montana’s climate normals, we aggregated daily data for each gridMET variable into monthly and annual averages or totals for each year in the 1991 - 2020 reference period. Then, we used the lmomco package in R to derive alpha and beta parameters that best fit the 30-year distribution of monthly or annual data for each pixel across Montana. Using these parameters we then derived the mean, median, mode and variance for each variable. Each of these options, as well as the raw alpha and beta values, can be selected from the “Select a Statistic” dropdown on the main tab.