Montana Drought & Climate — April Update
 A beautiful morning at the CSKT Bison Range, after a rainstorm.
Here’s what you’ll find in the April newsletter:
- An overview of the precipitation, drought, and temperature conditions across the state.
- The release of the Montana Mesonet phone App for Android!
- An in-depth look at spring hydrology conditions as April is a critical month for spring snowmelt, runoff, and soil moisture conditions.
- USDM Update.
MCO Update
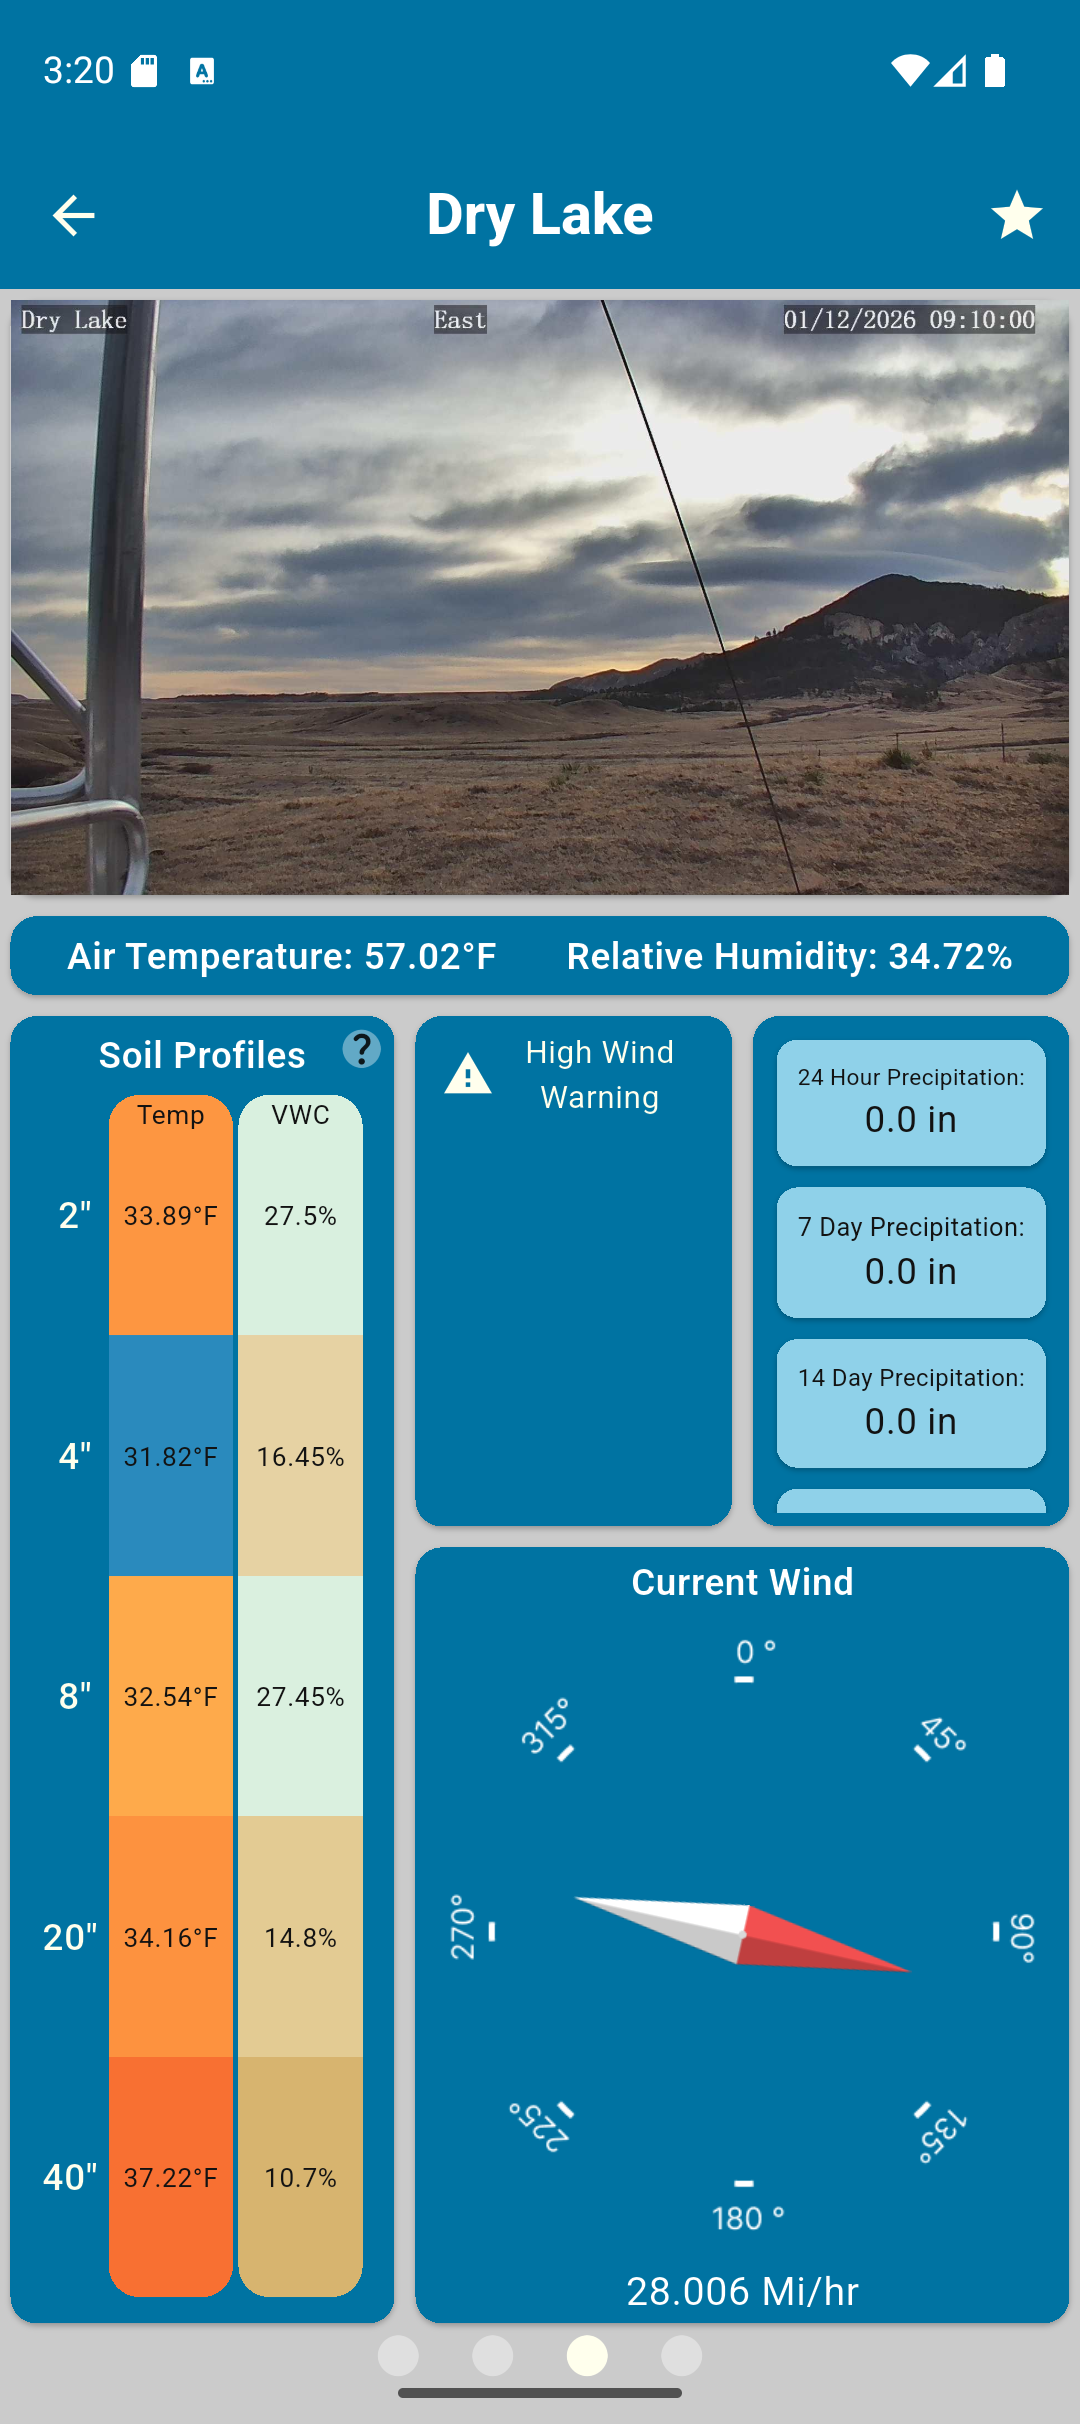
Montana Mesonet App for Android!
 {width=50%}
The Montana Mesonet app is now available for Android phones! This enables anyone to use the MCO dashboards with ease and check out your local stations for real-time weather, soil moisture, and snowpack data. Access all 216 Mesonet stations with more coming online this summer!
Download the Montana Mesonet App for Android here!
Look out for posts on our social media!
We will be posting all summer long, follow us for updates when our new stations come online, and learn all about the projects and tools the MCO has been working on!
Check out our social media pages!
In Brief
- April a “return to normal” for 2026 in terms of temperature and precipitation.
- CPC outlooks are predicting a warm and dry spring.
- Drought conditions have expanded in southwest.
- Spring runoff continues to be accelerated due to low snowpack.
Month Report
Temperature
Montana Temperature Deviation
 Source: Drought Data Dashboard.
Much of the northeastern part of Montana was within normal temperature ranges for April. The south and western parts of the state still held on to temperatures that were hotter than average, with the southwestern corner in the highest percentiles for the entire state, contributing to increases in the USDM status for that area.
Seasonal Temperature Outlook (MJJ)
 Source: Climate Prediction Center.
The CPC seasonal temperature outlook for May, June, and July has the probability of temperatures likely above normal across the entire state. The chance percentage goes down in the east.
Precipitation
Montana Precipitation Deviation
 Source: Drought Data Dashboard.
The MCO Drought Data Dashboard’s precipitation percentiles for April show pockets of both higher than average precipitation above 90% for the month and lower than 10–20% of typical precipitation in these areas over the rolling 30-year averages. The surrounding areas are within normal precipitation ranges. This shows the complexity of what is occurring across the state.
Seasonal Precipitation Outlook (MJJ)
 Source: Climate Prediction Center
The CPC outlook for precipitation is below average for most of the state. The southwest is leaning below average for spring precipitation. This, coupled with higher-temperature outlooks, indicates drought conditions will persist and worsen in the southwestern part of the state.
Monthly Precipitation Outlook
 Source: Climate Prediction Center
Monthly precipitation for May is projected to be leaning below normal precipitation, which will have implications for continued drought conditions this spring. Only the Hi-Line will have equal chances for normal precipitation.
Snowpack
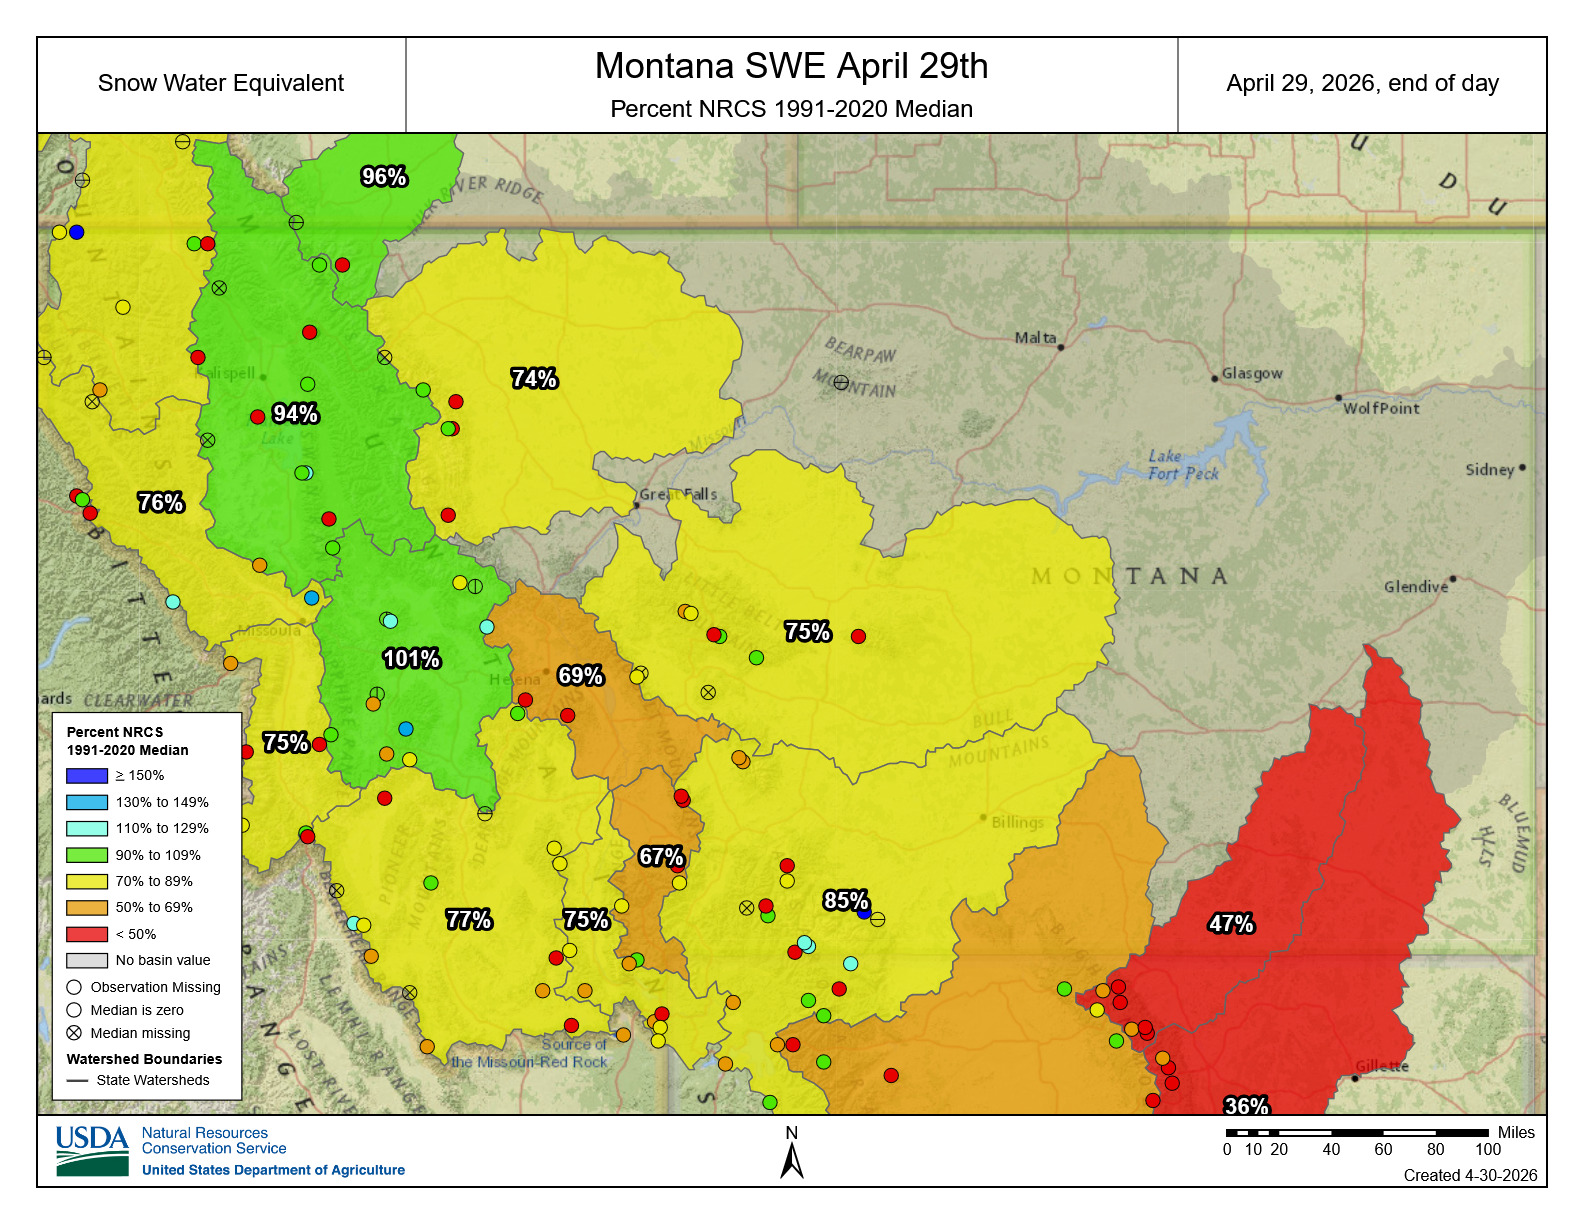 Source: USDA Snow and Water Interactive Map
SNOTEL shows SWE for most of the state above 70% normal as of the end of April, with a few northwest basins having snowpack above 90% normal. The Tongue River basin is at 47%, the lowest snowpack for this date in April. What is consistent across most stations, is that the high elevation areas are holding almost all the snowpack left, and the lower and mid stations are reporting low to no snowpack.
Streamflow
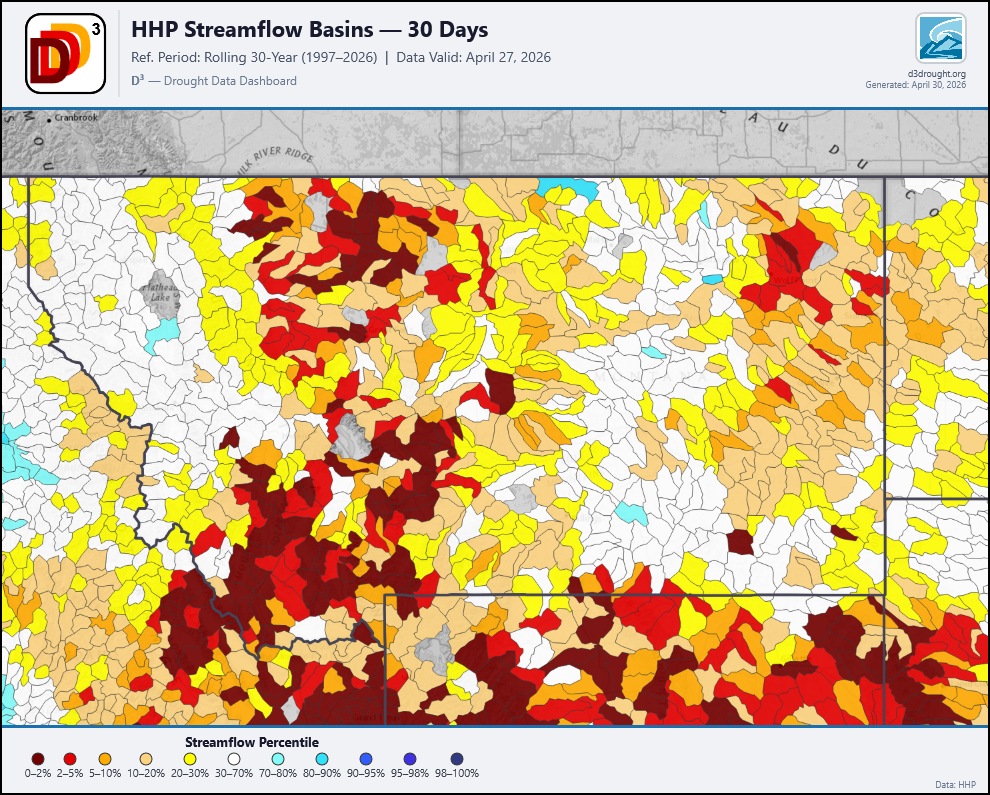 Source: Drought Data Dashboard.
Due to warm conditions and limited snowpack, streamflow percentiles are continuing to drop across much of the central and southwestern parts of the state as accelerated spring runoff continues. Many basins are experiencing daily 30-year minimums.
Drought
April USDM Status
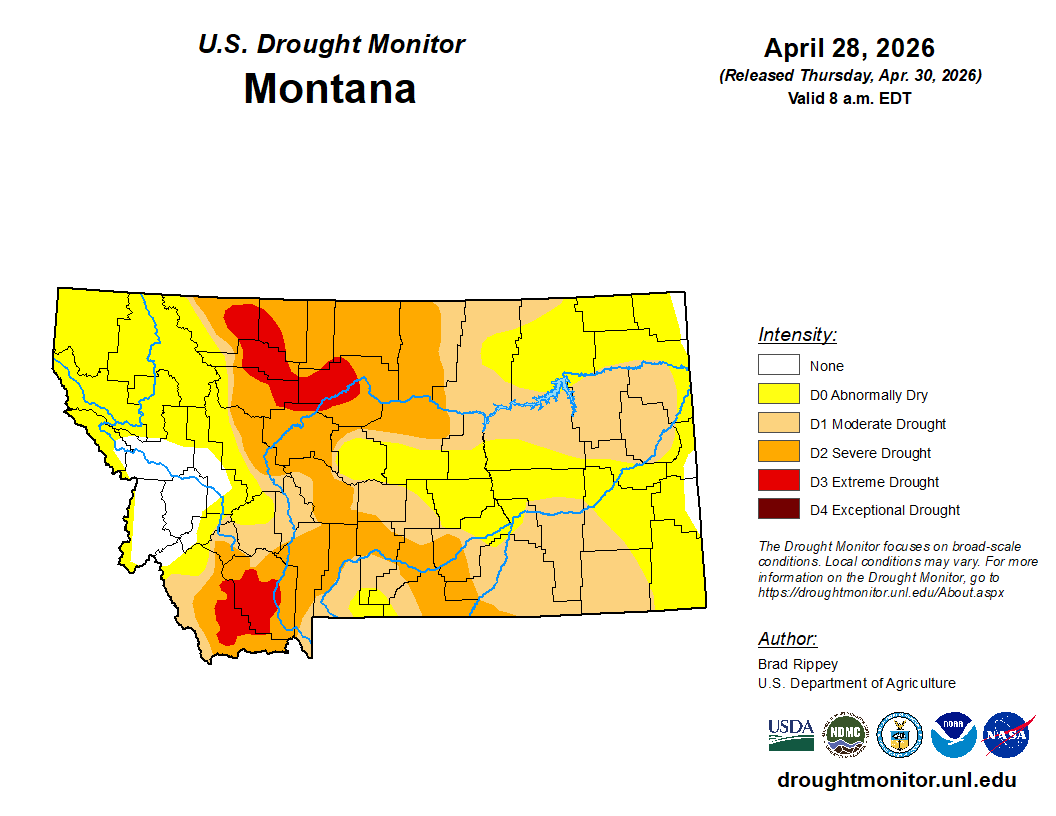 Source: [USDM Montana Map](https://droughtmonitor.unl.edu/(https://droughtmonitor.unl.edu/CurrentMap/StateDroughtMonitor.aspx?MT)
The USDM has updated to extend extreme (D4) drought through Pondera county, into Toole and Glacier counties, with Teton and Choteau counties maintaining their extreme drought (D4) status. In the eastern part of the state, abnormally dry conditions have spread into Wibaux, Richland, and Roosevelt counties. The southwest of Montana is still maintaining extreme drought conditions.
USDM 4 Week Class Change
 Source: UNL NDMC.
Most of the significant class degradations in the last month occurred in Beaverhead, Madison, and Gallatin counties, with a class degradation extending into Bighorn County.
Class improvements have occurred in the northwestern and northeastern part of the state.
Seasonal Drought Outlook
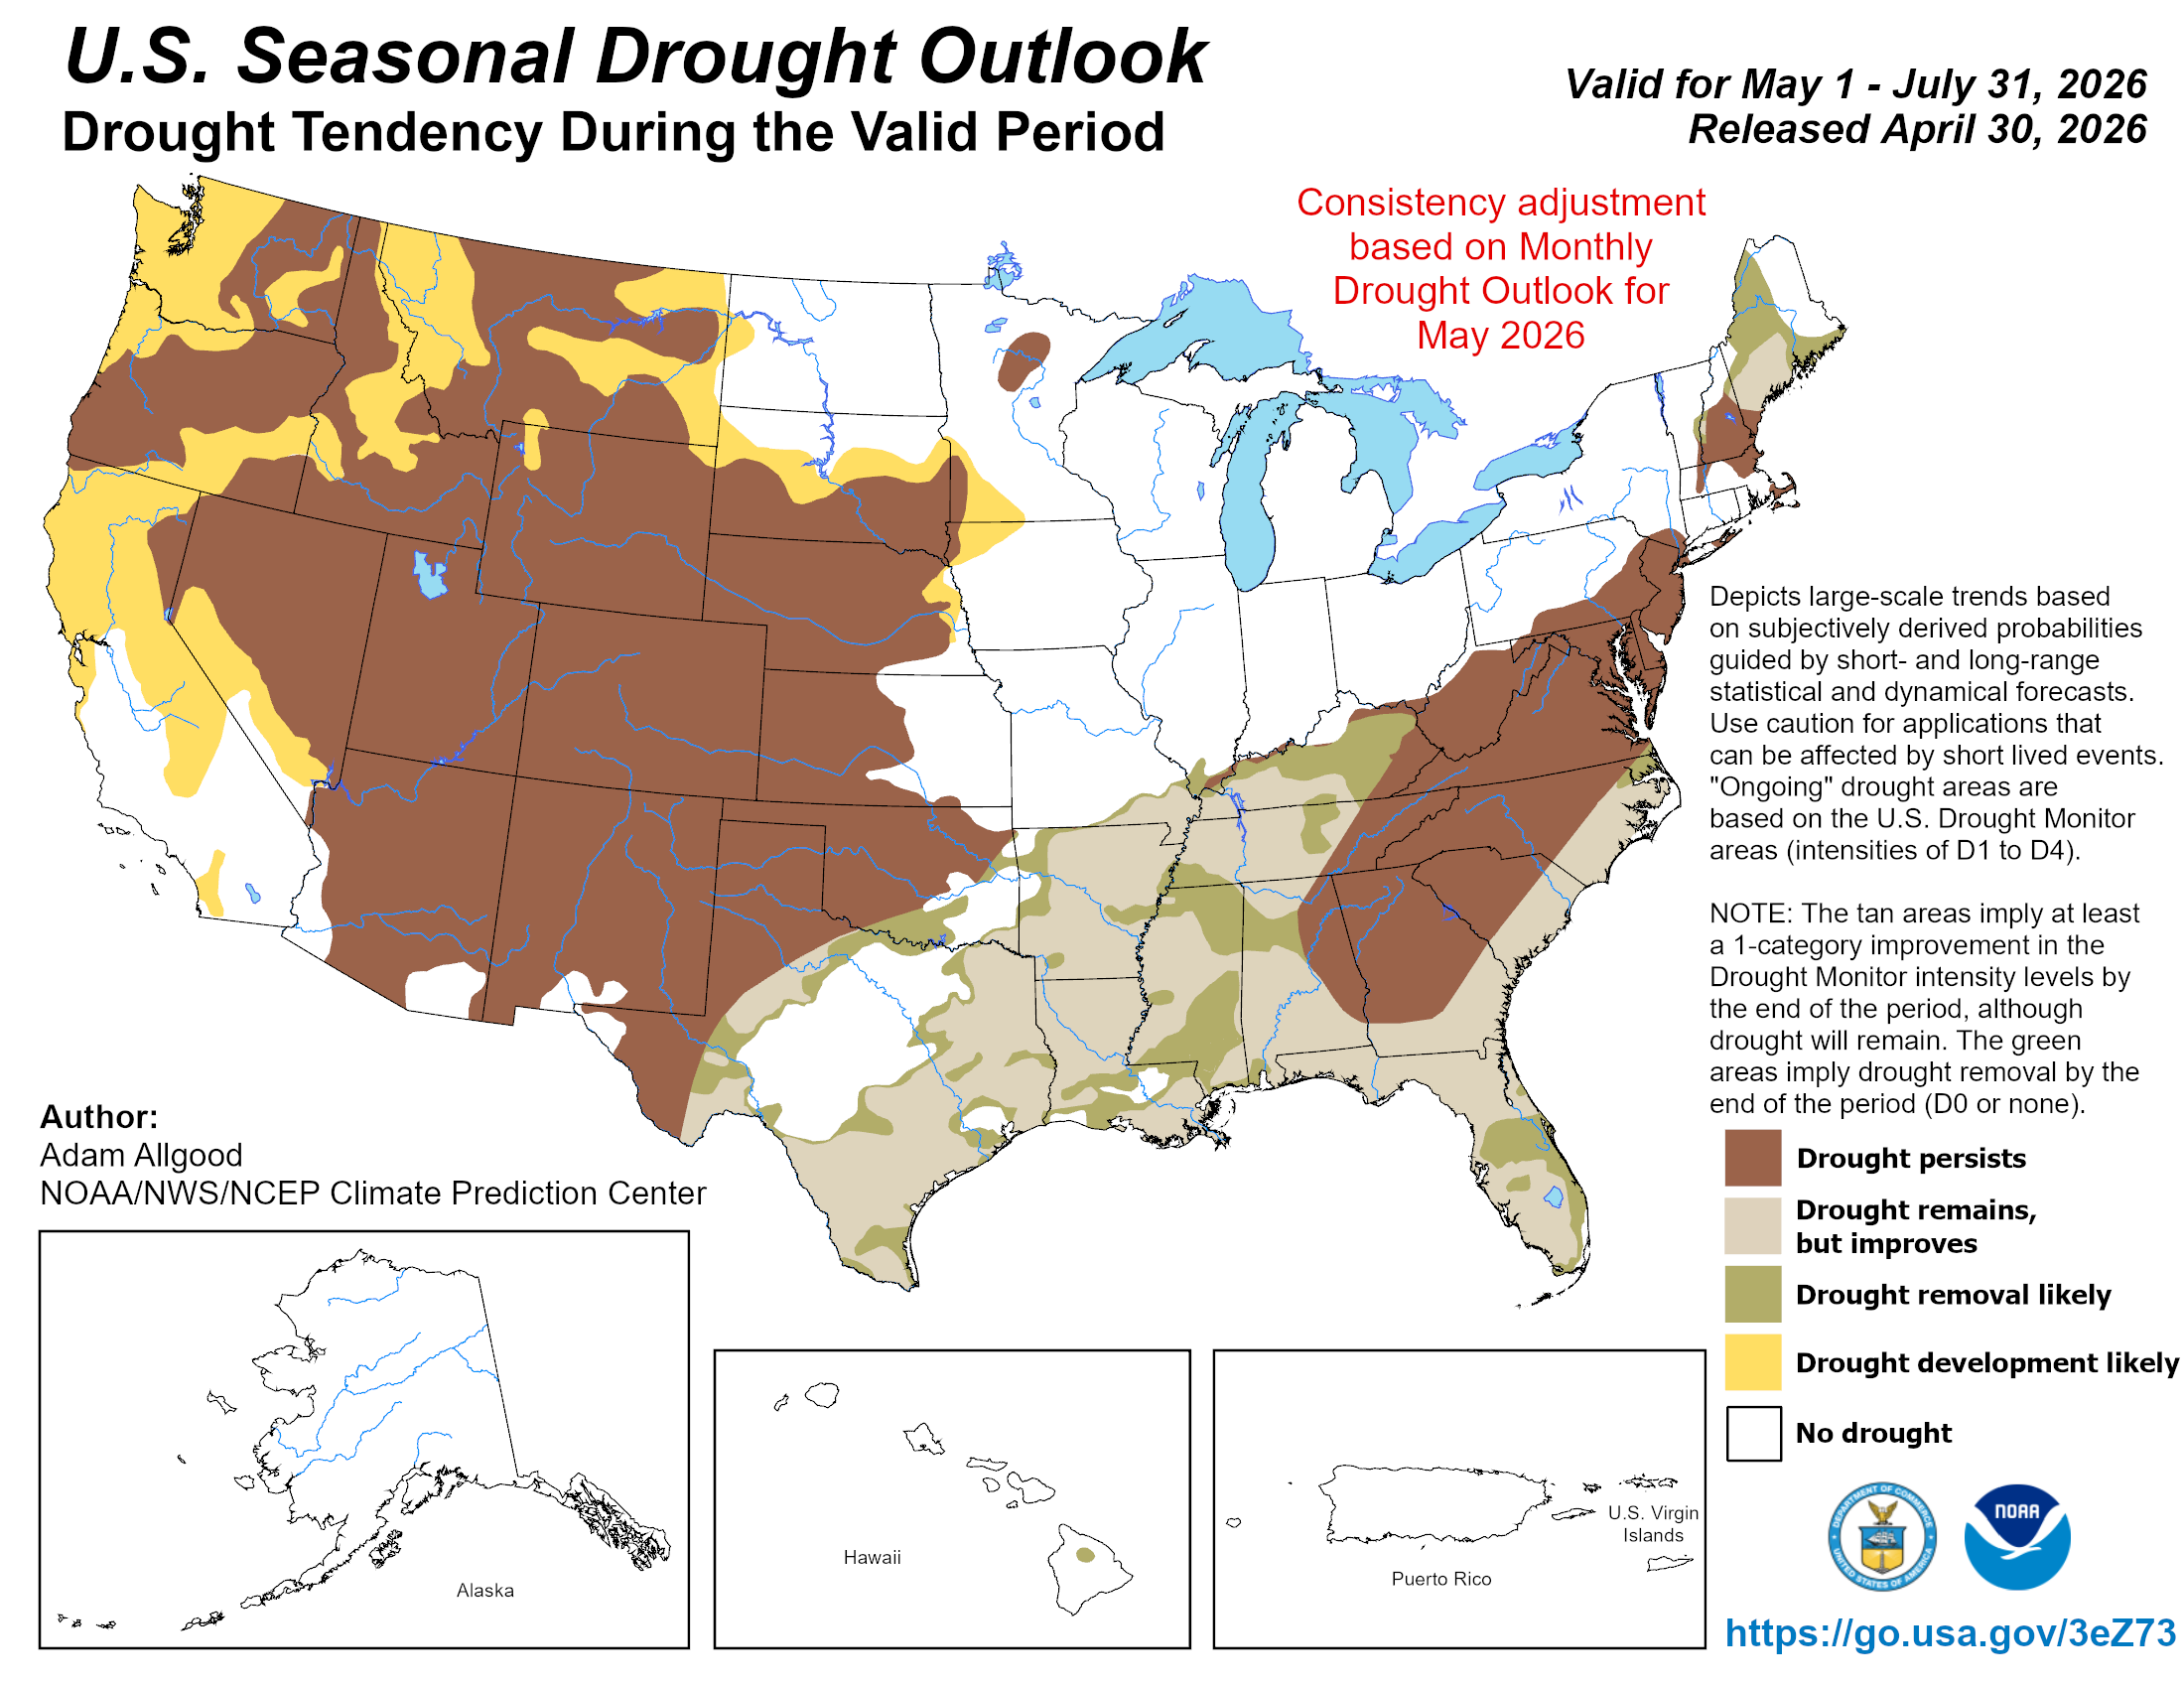 Source: NOAA Drought Outlook Map.
Drought development is likely this spring and summer across all of Montana that was not already in drought conditions. Drought will persist across much of the state as streamflow continues to decline, while warm temperatures and limited precipitation affect soil moisture conditions.
Soil Moisture

The SPoRT soil moisture model indicates standardized soil moisture index values around -2 in areas of southwest and northeast corners of Montana suggesting conditions are much drier than normal heading into the growing season. Portions of western and central Montana as well as the area east of Billings show high soil moisture anomalies.
ENSO
 Source: the Climate Prediction Center/NCEP/NWS
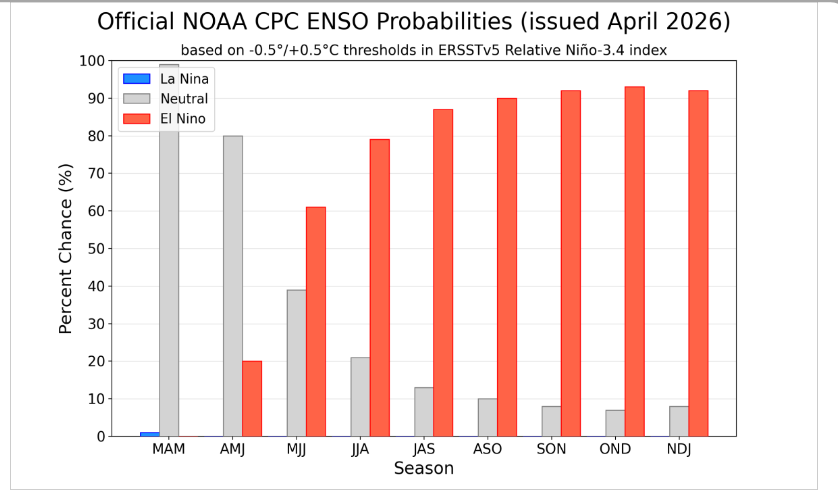
The transition from La Niña to ENSO neutral is expected within the next month. ENSO-neutral is favored through May-July, with a 62% likelihood of El Niño beginning in June-August and lasting through the end of 2026.
Reference
![]() Weather and Climate — The difference between weather and climate is timescale. Weather is the day-to-day interaction of factors like temperature, humidity, precipitation, cloudiness, visibility, and wind. To understand climate at a given place requires looking at weather trends over relatively long periods of time—months, years, and decades. In addition to studying weather, scientists examine climate trends or cycles of variability to understand the bigger picture of long-term changes.
Weather and Climate — The difference between weather and climate is timescale. Weather is the day-to-day interaction of factors like temperature, humidity, precipitation, cloudiness, visibility, and wind. To understand climate at a given place requires looking at weather trends over relatively long periods of time—months, years, and decades. In addition to studying weather, scientists examine climate trends or cycles of variability to understand the bigger picture of long-term changes.
![]() Temperature and Precipitation — Throughout this newsletter, we report past temperature and precipitation data derived directly from the GridMET daily 4-km-gridded meteorological dataset from the University of Idaho. Temperature data are reported as seasonal averages; precipitation data are reported as seasonal total precipitation. Our three-month temperature and precipitation forecasts come from NOAA’s Climate Prediction Center.
Temperature and Precipitation — Throughout this newsletter, we report past temperature and precipitation data derived directly from the GridMET daily 4-km-gridded meteorological dataset from the University of Idaho. Temperature data are reported as seasonal averages; precipitation data are reported as seasonal total precipitation. Our three-month temperature and precipitation forecasts come from NOAA’s Climate Prediction Center.
![]() Climatologists use the term “normal” to compare current conditions or forecasts, such as temperature or precipitation, to the past. Here, the normal value is the statistical mean (the average) for a given measurement in a specific place during a specific period of time. Climatologists use the most recent 30-year period, rounded to the nearest decade, to define normal in North America: 1981–2010. The goal is to look far enough back in time to capture variation in weather patterns, but not so far as to be irrelevant to recent conditions. In 2026, we will start using the 1996–2026 period.
Climatologists use the term “normal” to compare current conditions or forecasts, such as temperature or precipitation, to the past. Here, the normal value is the statistical mean (the average) for a given measurement in a specific place during a specific period of time. Climatologists use the most recent 30-year period, rounded to the nearest decade, to define normal in North America: 1981–2010. The goal is to look far enough back in time to capture variation in weather patterns, but not so far as to be irrelevant to recent conditions. In 2026, we will start using the 1996–2026 period.
![]() La Niña/El Niño — El Niño and La Niña are the warm and cool phases of a recurring climate pattern across the tropical Pacific, the El Niño Southern Oscillation (ENSO). When ENSO is between warm and cool phases, conditions are called ENSO Neutral. ENSO is one of several global climate phenomena that affect Montana’s weather patterns, and ENSO conditions often guide seasonal climate projections for Montana. Current ENSO conditions and up-to-date projections are available on NOAA’s ENSO website.
La Niña/El Niño — El Niño and La Niña are the warm and cool phases of a recurring climate pattern across the tropical Pacific, the El Niño Southern Oscillation (ENSO). When ENSO is between warm and cool phases, conditions are called ENSO Neutral. ENSO is one of several global climate phenomena that affect Montana’s weather patterns, and ENSO conditions often guide seasonal climate projections for Montana. Current ENSO conditions and up-to-date projections are available on NOAA’s ENSO website.
![]() Snow Water Equivalent (SWE) — SWE is the amount of water contained within the snowpack. It can be thought of as the depth of water that would theoretically result if you melted the entire snowpack. SWE is measured across the West by the USDA Natural Resources Conservation Service’s SNOTEL network of snow monitoring stations. The SWE percent of normal represents the current snow water equivalent found at selected SNOTEL sites in the basin compared to the normal value for those sites from 1981–2010.
Snow Water Equivalent (SWE) — SWE is the amount of water contained within the snowpack. It can be thought of as the depth of water that would theoretically result if you melted the entire snowpack. SWE is measured across the West by the USDA Natural Resources Conservation Service’s SNOTEL network of snow monitoring stations. The SWE percent of normal represents the current snow water equivalent found at selected SNOTEL sites in the basin compared to the normal value for those sites from 1981–2010.
![]() Root Zone Soil Wetness — Root Zone Soil Wetness is a measure of how much water has saturated the soil. More specifically, it’s the relative saturation between completely dry (indicated by a 0) and completely saturated (indicated by a 1) between 0 and 100 cm depth. In the maps in this newsletter, soil saturation comes from NASA’s Soil Moisture Active Passive (SMAP) satellite program “SPL4SMGP” data product. Soil moisture is mapped using a combination of radar and radiometer measurements from space and surface observations at an approximately 9-km spatial resolution.
Root Zone Soil Wetness — Root Zone Soil Wetness is a measure of how much water has saturated the soil. More specifically, it’s the relative saturation between completely dry (indicated by a 0) and completely saturated (indicated by a 1) between 0 and 100 cm depth. In the maps in this newsletter, soil saturation comes from NASA’s Soil Moisture Active Passive (SMAP) satellite program “SPL4SMGP” data product. Soil moisture is mapped using a combination of radar and radiometer measurements from space and surface observations at an approximately 9-km spatial resolution.