Montana Drought & Climate — January 2026 Update
Welcome to the 2026 Montana Drought & Climate newsletter series. In this series, we will provide monthly updates and information about snowpack, drought conditions, temperature trends, and more. We hope this information will be helpful to Montana’s agricultural producers, communities, and tribal nations. Additionally, we will share work the Montana Climate Office has been doing and look at the tools our office has developed.
This edition is the first in the series, offering a look at what Montana experienced this January.

Here’s what you’ll find in this newsletter:
MCO Update — What’s been happening at the Montana Climate Office this year, and what to look forward to!
2025 Review — A brief overview of 2025’s weather and climate patterns.
January Update — This update looks at how the winter has been progressing throughout January. We go over snowpack, temperature, precipitation, and drought conditions. We also provide previews of what to expect in the coming months, by sharing predictive outlooks of those conditions.
Reference — A helpful glossary of terms can be found at the bottom of this newsletter.
MCO Update:
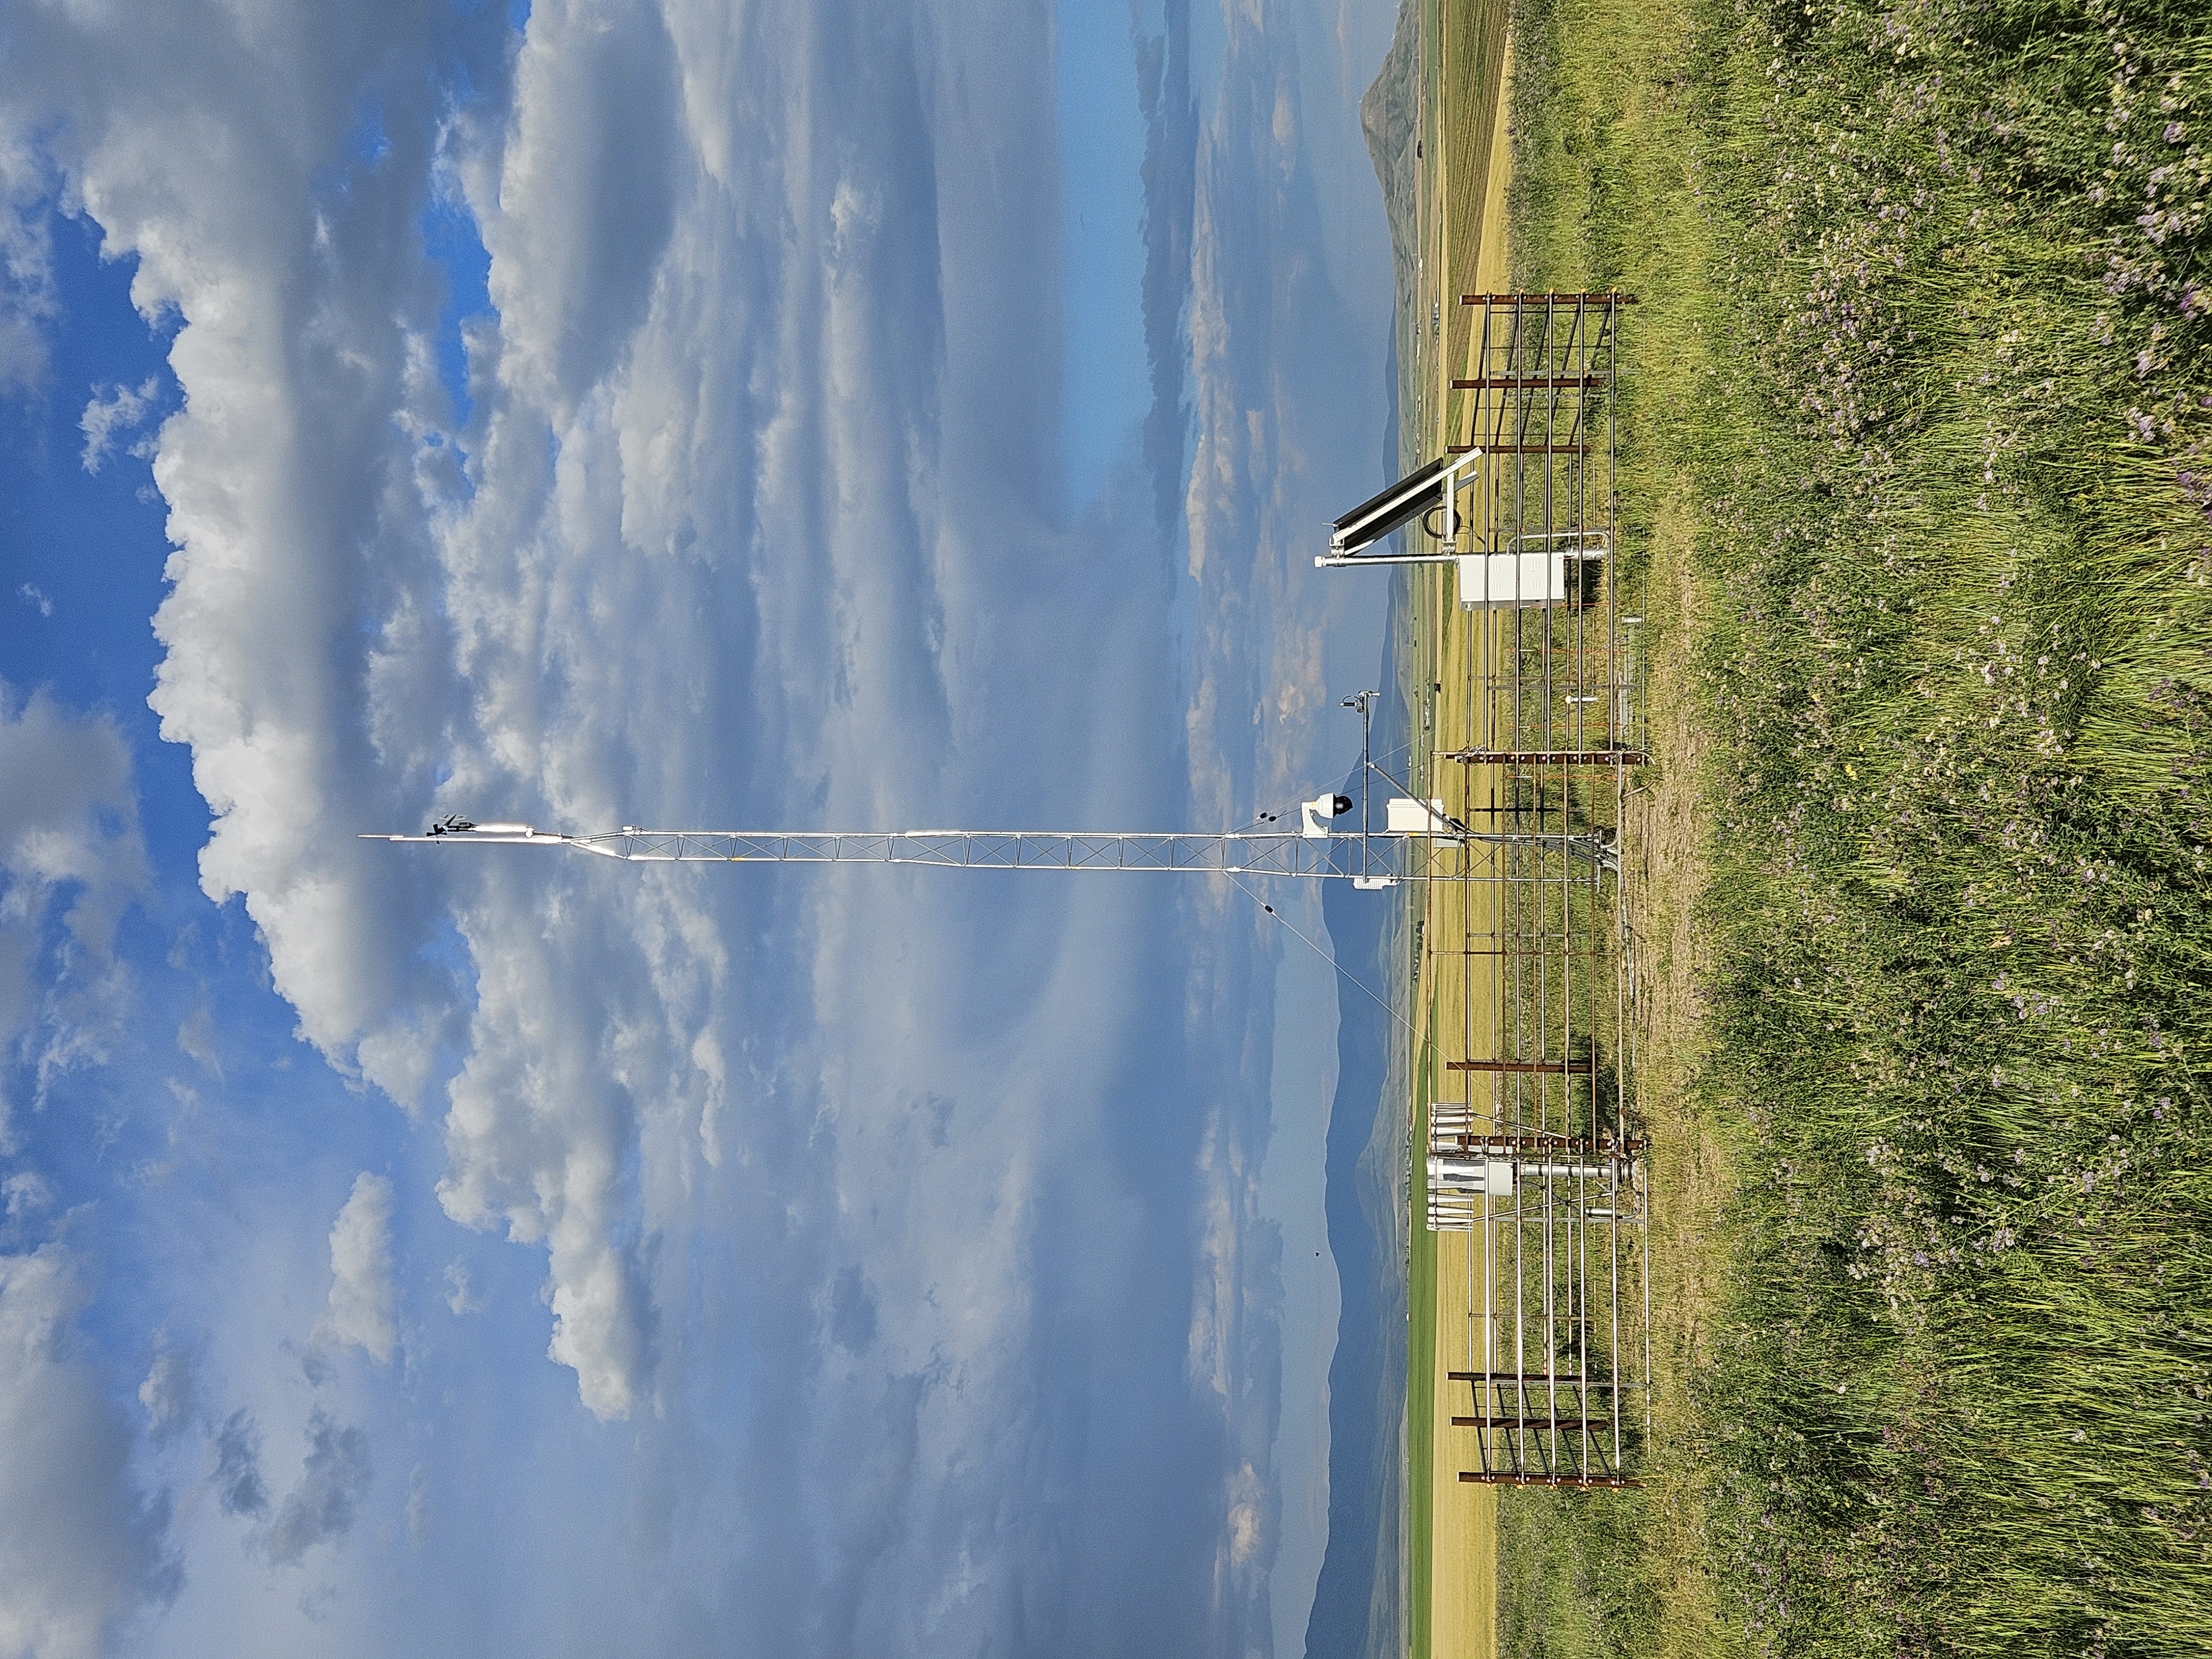 Photo of the Belt Northwest station, installed in 2025.
The Montana Climate Office now has 217 operational Mesonet Stations. 39 new HydroMet stations were installed in 2025. This expands our network, improving our ability to provide real-time soil moisture and drought monitoring for agricultural producers and Montana communities that previously lacked coverage.
We have a busy schedule this upcoming build season! We are installing 38 new Mesonet HydroMet stations. Our crews will be throughout eastern Montana this summer, primarily in the southeastern corner of the state. The blue triangles in the image below show the planned station installations.
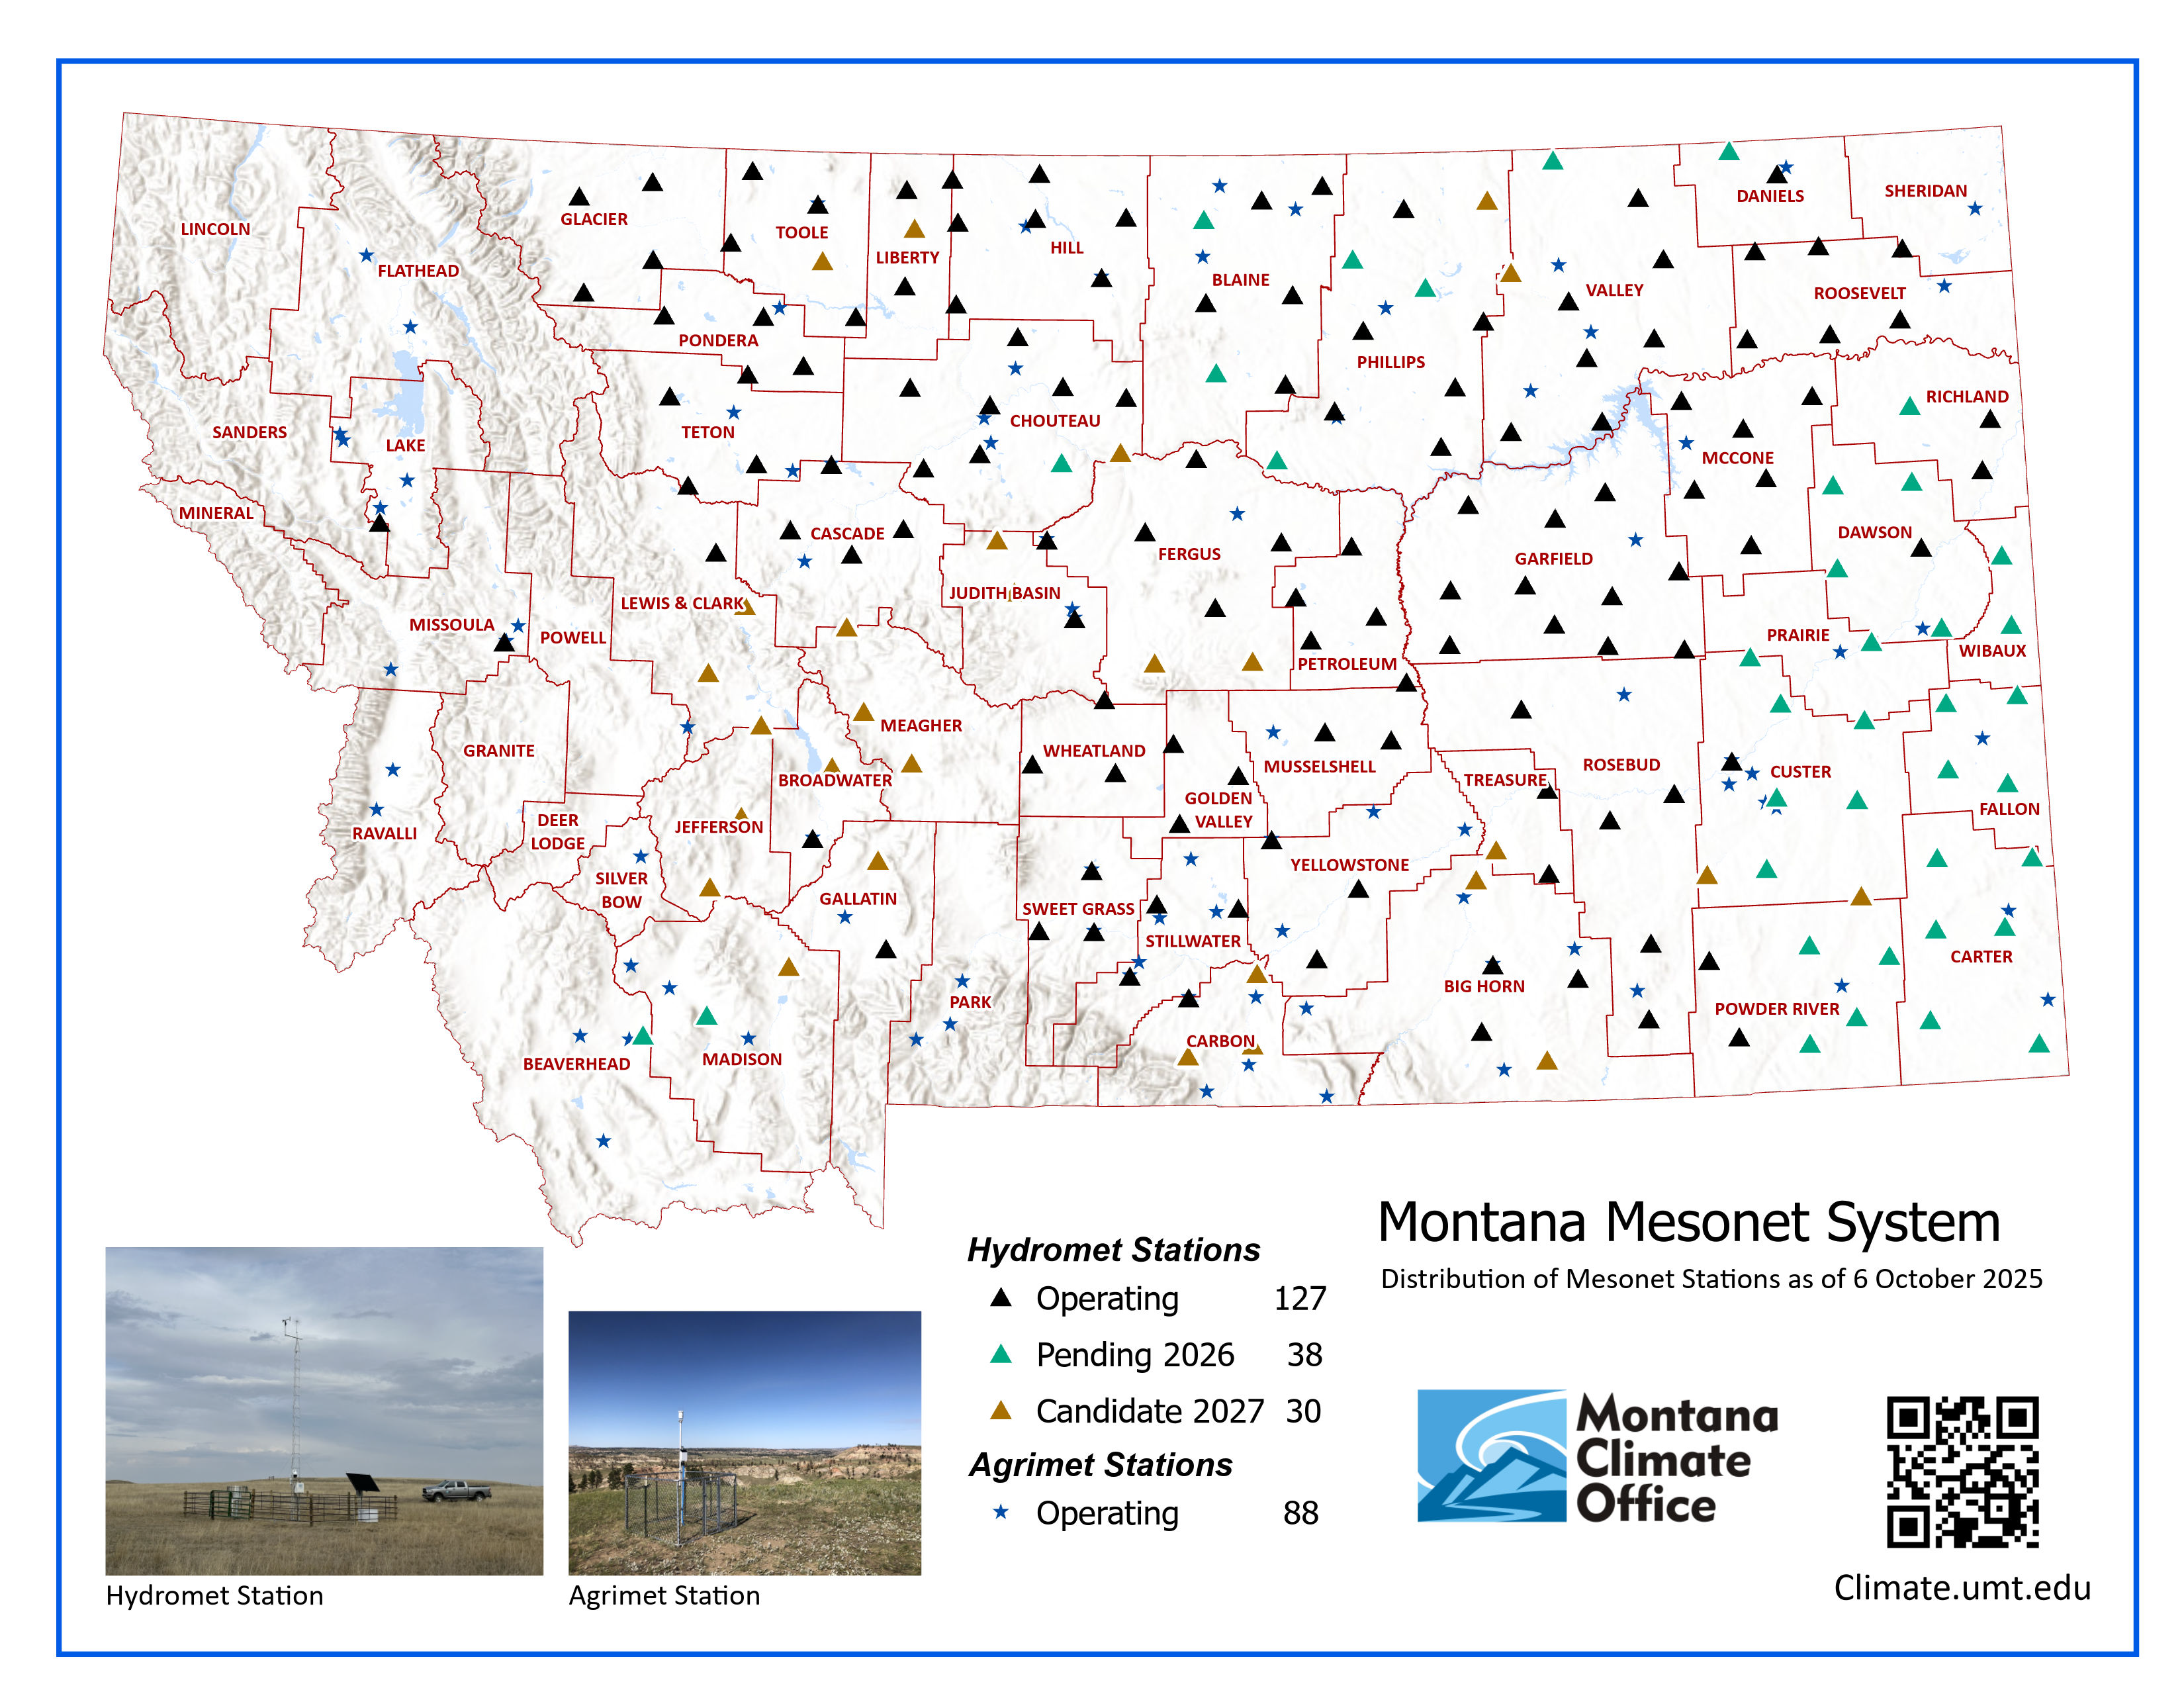 Map showing the distribution of installed and planned Mesonet Stations. Blue triangles mark planned 2026 station installations.
Mesonet App
Be on the lookout for the MCO Mesonet phone app! The MCO Mesonet app is in development here at the Montana Climate Office and will be available on both Android and Apple iOS!
The Montana Climate Office looks forward to debuting this convenient, user-friendly app that delivers real-time Mesonet station weather and soil moisture data directly to your phone.
In Brief
-
Much of western and central Montana has experienced record warm temperatures, 10-15 degrees above normal, multiple times throughout December and January.
-
January had below normal precipitation totals for most of the state, differing from the above normal precipitation in December.
-
February outlook looks to be on track for realigning into a more recognizable pattern of precipitation and temperature, with equal chances of higher or lower temperatures and precipitation.
-
La Niña is predicted to transition to ENSO Neutral this spring.
2025 Review
Warmer-than-normal temperatures marked 2025. A warm spring caused rapid snowmelt at high elevations, leading to lower surface water amounts in our runoff season. The state remained abnormally dry and in drought conditions throughout the summer. During the fall and early winter, temperatures were above normal, with normal precipitation, except in December, which brought high precipitation amounts to some areas; these precipitation events led to above-average snowpack at higher elevations. The warm temperatures, however, set up 2026 for mid to low elevation areas to have snowpack deficits over the winter.
January Report
Temperature
Montana Temperature Deviation
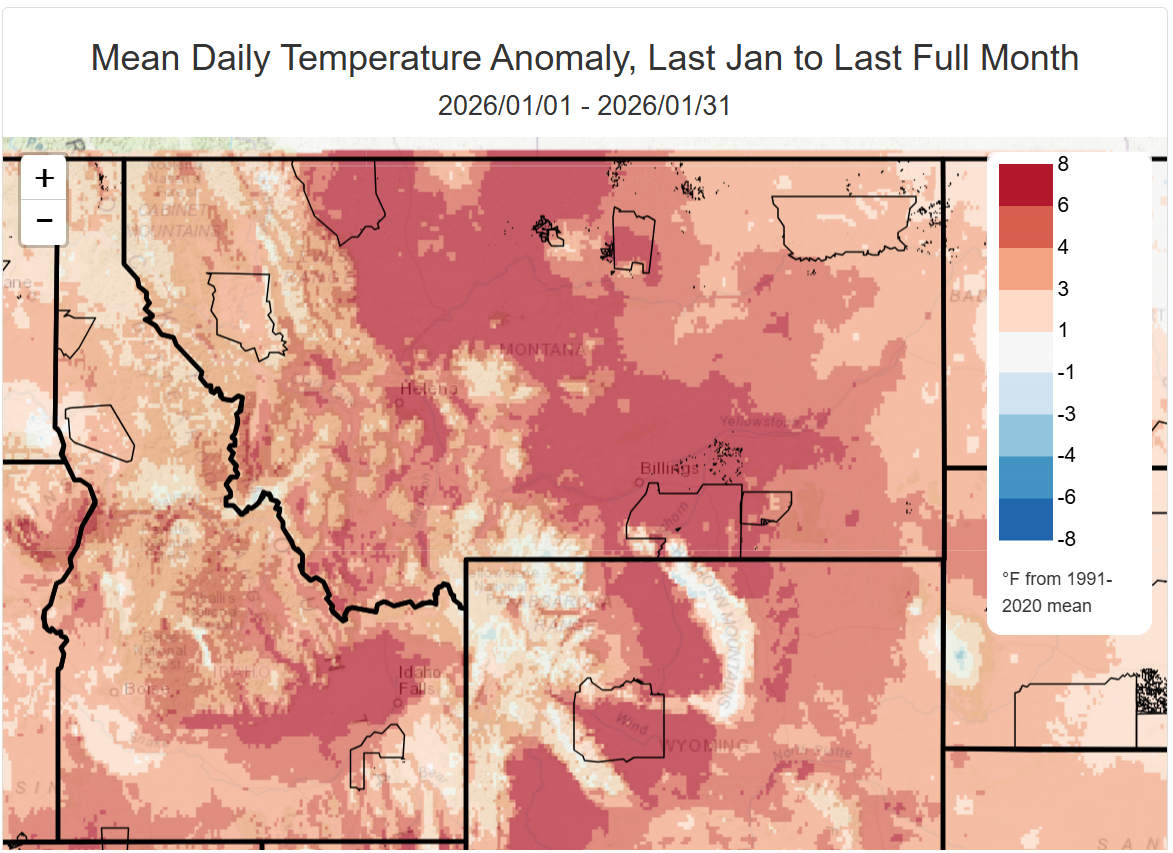 Map of daily temperature anomaly created through the climate toolbox mapper.
Montana has experienced record warm temperatures across the state this January. The central swath of the state experienced temperatures 8°F or more above normal for the greater part of the month. The northwest and northeast corners of the state have experienced temperatures on average 1-3°F warmer than normal.
An exception to this warmth was the third week of January, which brought a cold airmass into eastern Montana, with temperatures deep into the sub-zero range. Overall, this winter’s anomalous warmth and corresponding lack of snowpack could have serious future implications for wildfire activity and summer water supplies.
Seasonal Temperature Outlook
 Seasonal Temperature Outlook Map.](/assets/posts/2026-03-16-mtdrought-and-climate-2026-January/images\seasonal_temp_prediction_feb_apr.png)
Climate Prediction Center Seasonal Temperature Outlook Map.
The seasonal temperature outlook shows that the state will lean below normal temperatures, with the northeastern half of the state having a bit higher (40-50%) chance of below normal temperatures. The southwestern corner of Montana has equal chances of either scenario.
Precipitation
 Map of total precipitation anomaly created through the Climate Mapper Climate Toolbox.
This January, the majority of the state has received 60% of normal precipitation, with most of central Montana at 40% or less of normal for the year. Only the eastern side of the state has had precipitation amounts near, but still below normal.
This precipitation trend is below December’s, which had above-normal precipitation levels across the state and some severe precipitation events. On December 10-12, an atmospheric river flooded Libby, Montana, causing a preliminary estimation of $10 million in infrastructure damage, by extreme flooding that took out roads, bridges, and damaged buildings. The cost of the damage is expected to increase. 12 inches of rain fell in a 6-day period over the area. -NWS Missoula & MT Free Press.
Seasonal Precipitation Outlook
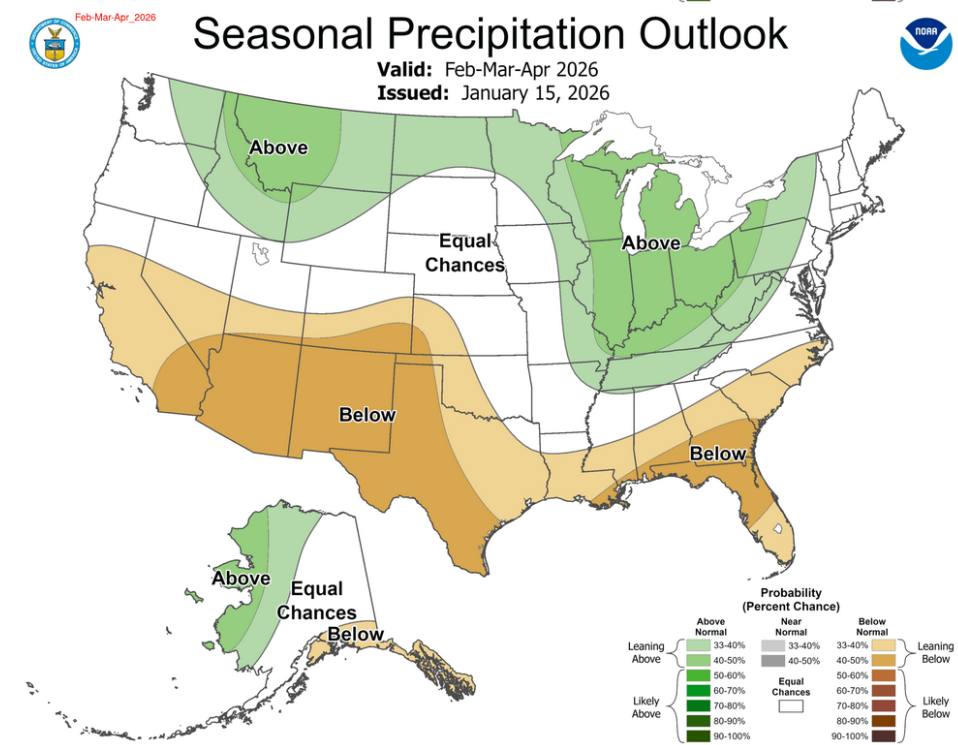 NOAA Seasonal Precipitation Outlook Map.
The seasonal precipitation outlook is trending toward above-normal precipitation across the state, with the western half having a higher probability of above-normal seasonal precipitation.
Snowpack
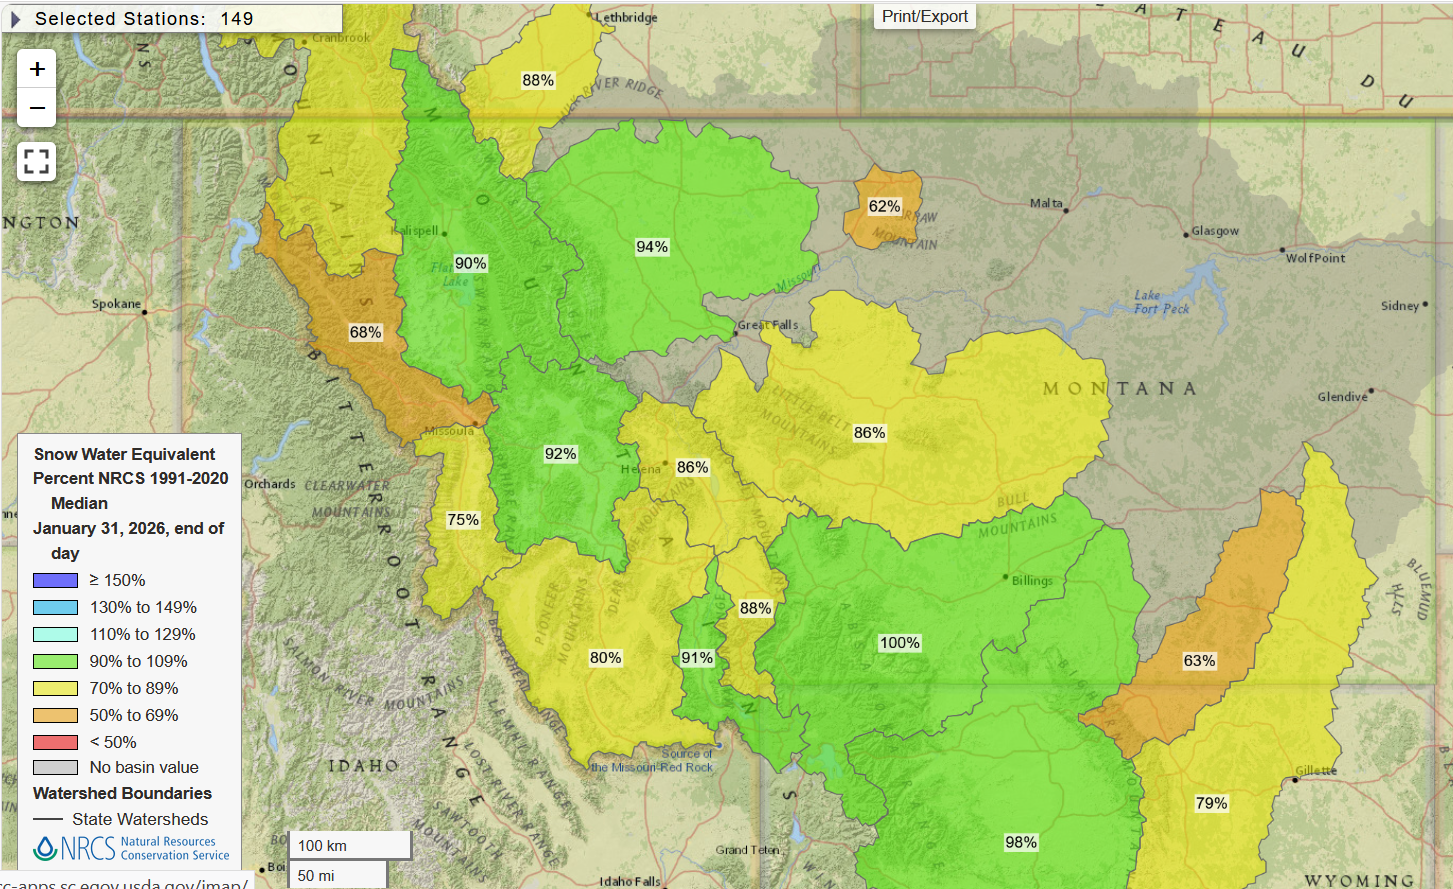 Image by USDA Snow and Water Interactive Map.
December brought record-breaking precipitation across mountain ranges. With the warm conditions, most of the precipitation fell as rain, except in high-elevation areas. The above-average precipitation trend stalled out after the beginning of January and slowed towards the end of the month. This resulted in low snowpack totals at lower elevations across multiple ranges in Montana. Higher elevations are still maintaining normal or slightly below-normal snowpack levels for this time of year, with many basins above 80% median SWE.
Drought
January USDM Status
![]()
 USDM January Drought Status Map of Montana
22.9% of the state is in drought (D1-D4), and 55.6% of the state is categorized as abnormally dry. With warm temperatures, snow drought has persisted in lower and mid-elevations, though higher precipitation has improved drought conditions in the northern and southwestern parts of the state.
USDM 4 Week Class Change
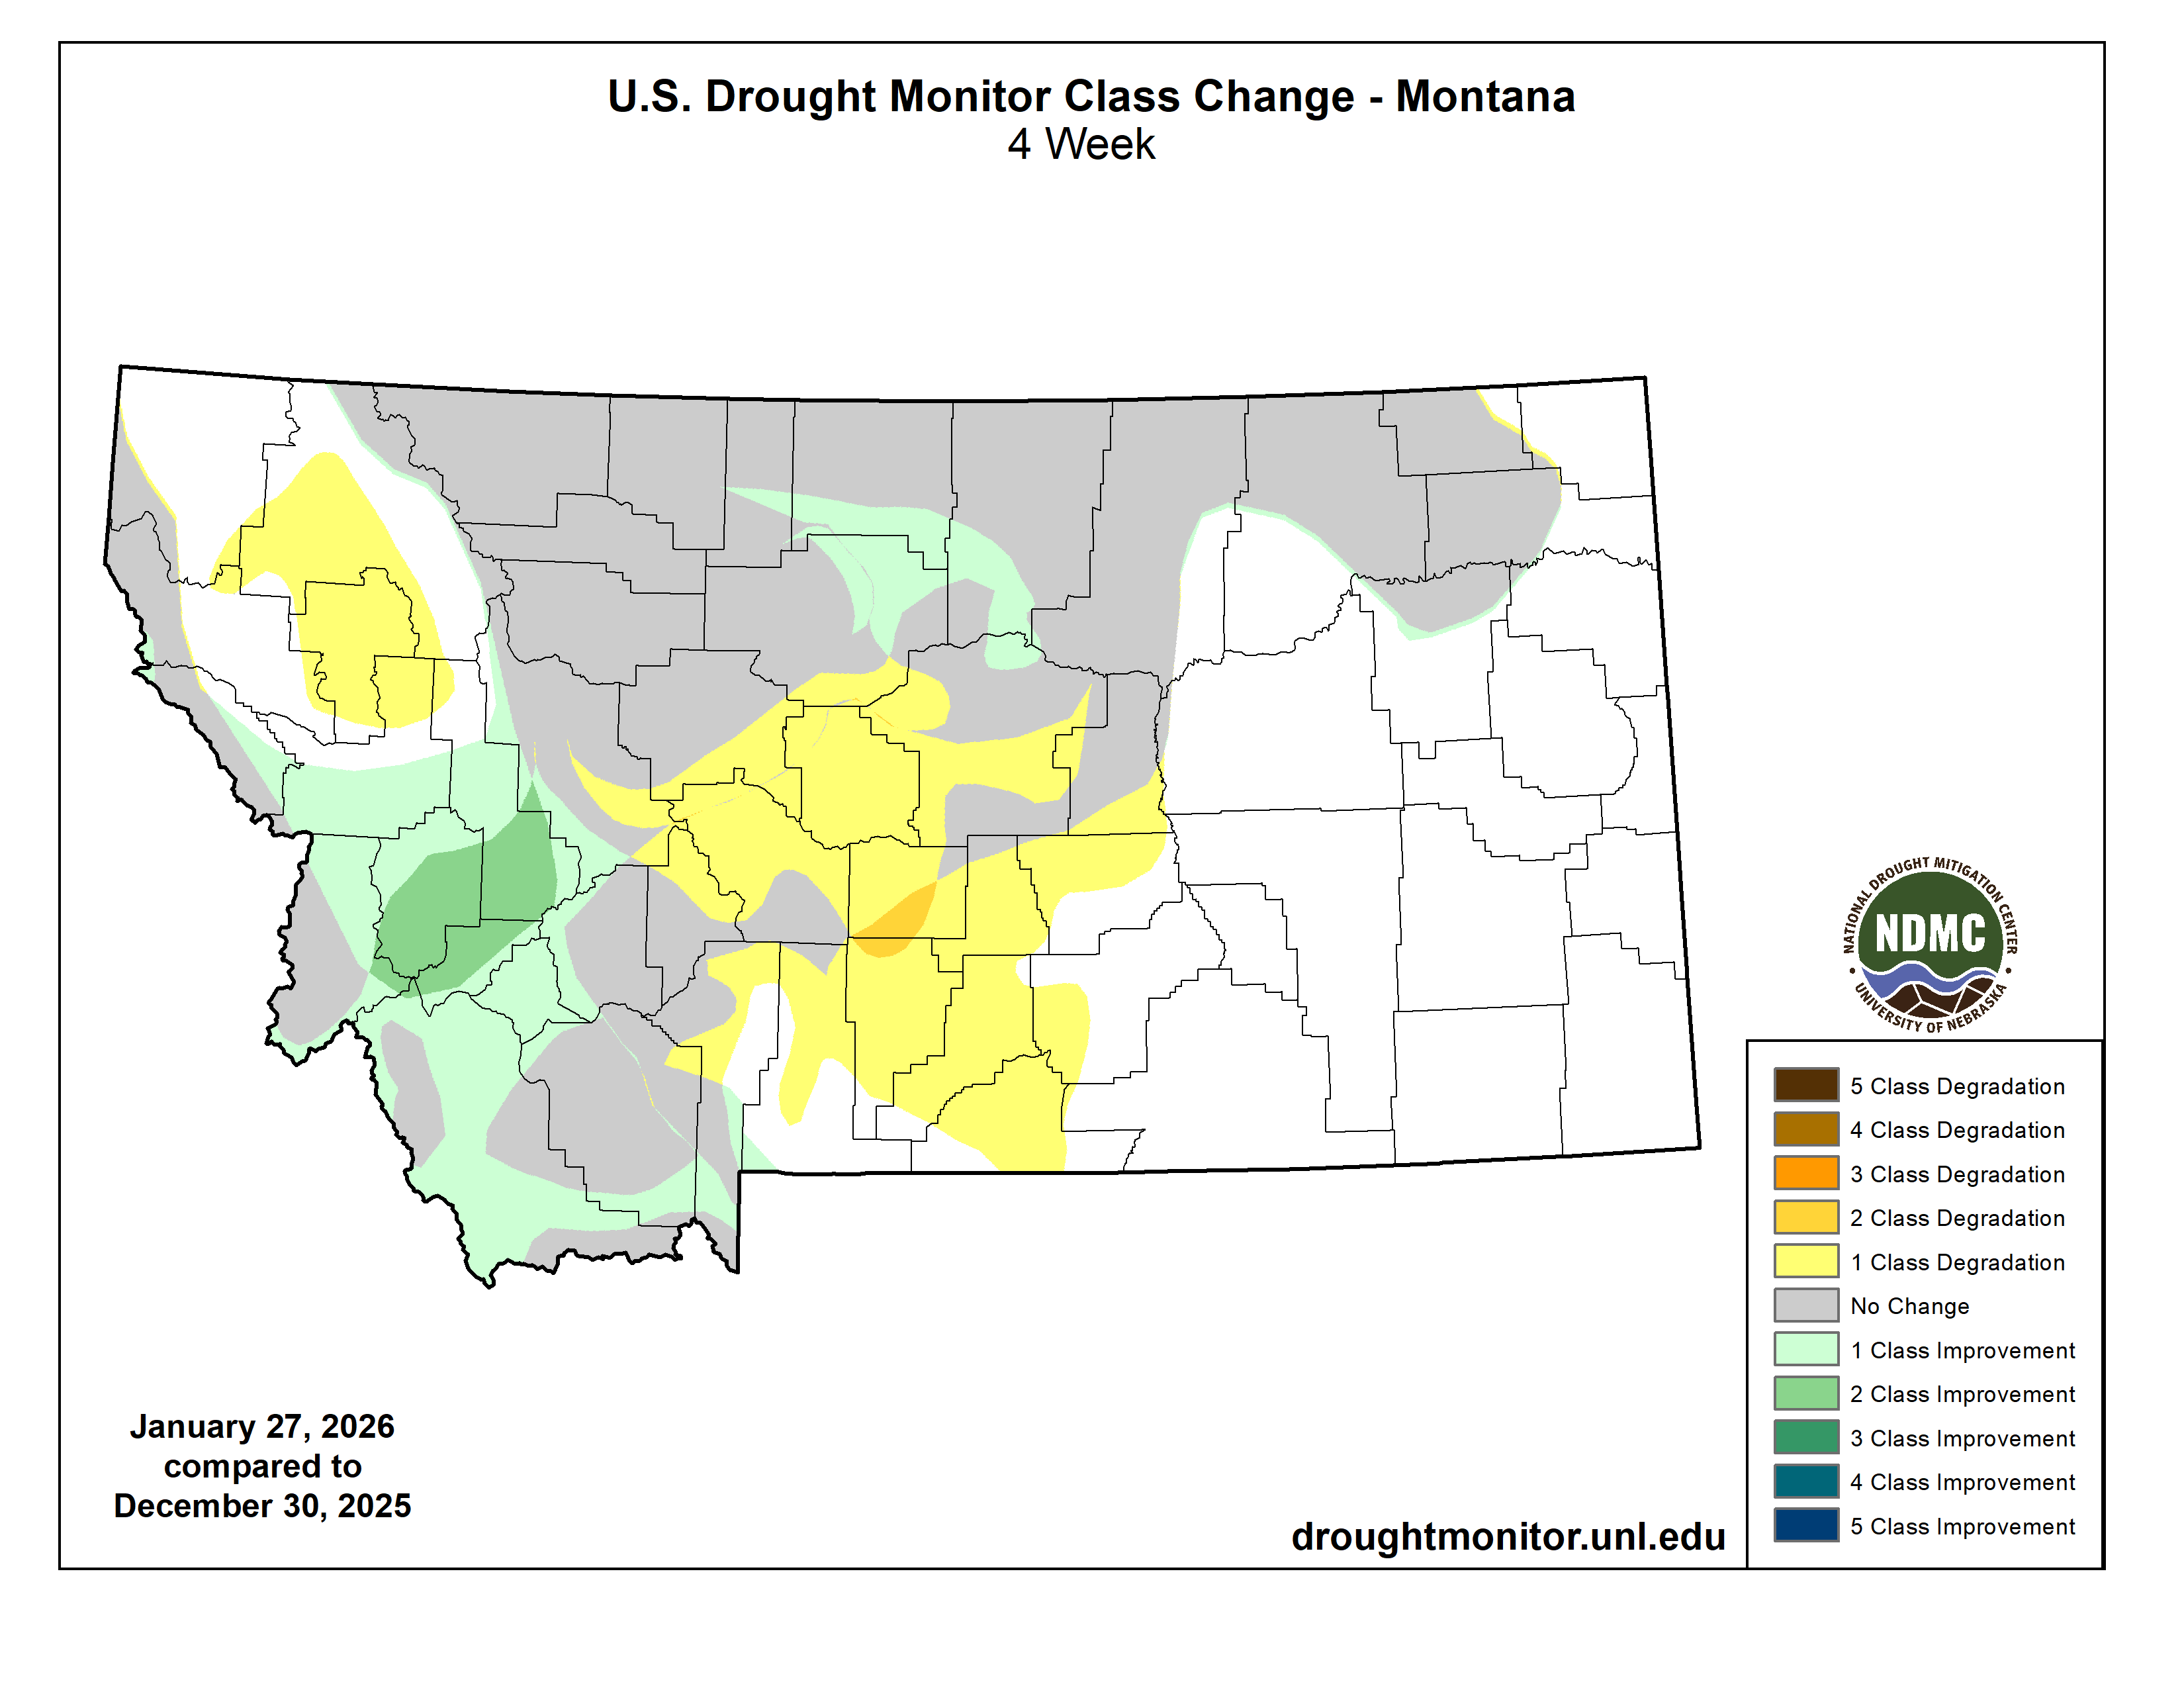 Four week change map by UNL NDMC.
The map above shows the 4-Week change of drought conditions across Montana from December to January. Most of the state showed no change in drought conditions. The southwest corner has shown a pocket of improvement by 1-category, and within that, a smaller area that has a 2-category improvement. Central Montana southward have shown a drought degradation of 1-category.
Seasonal Drought Outlook (Jan-Apr 2026)
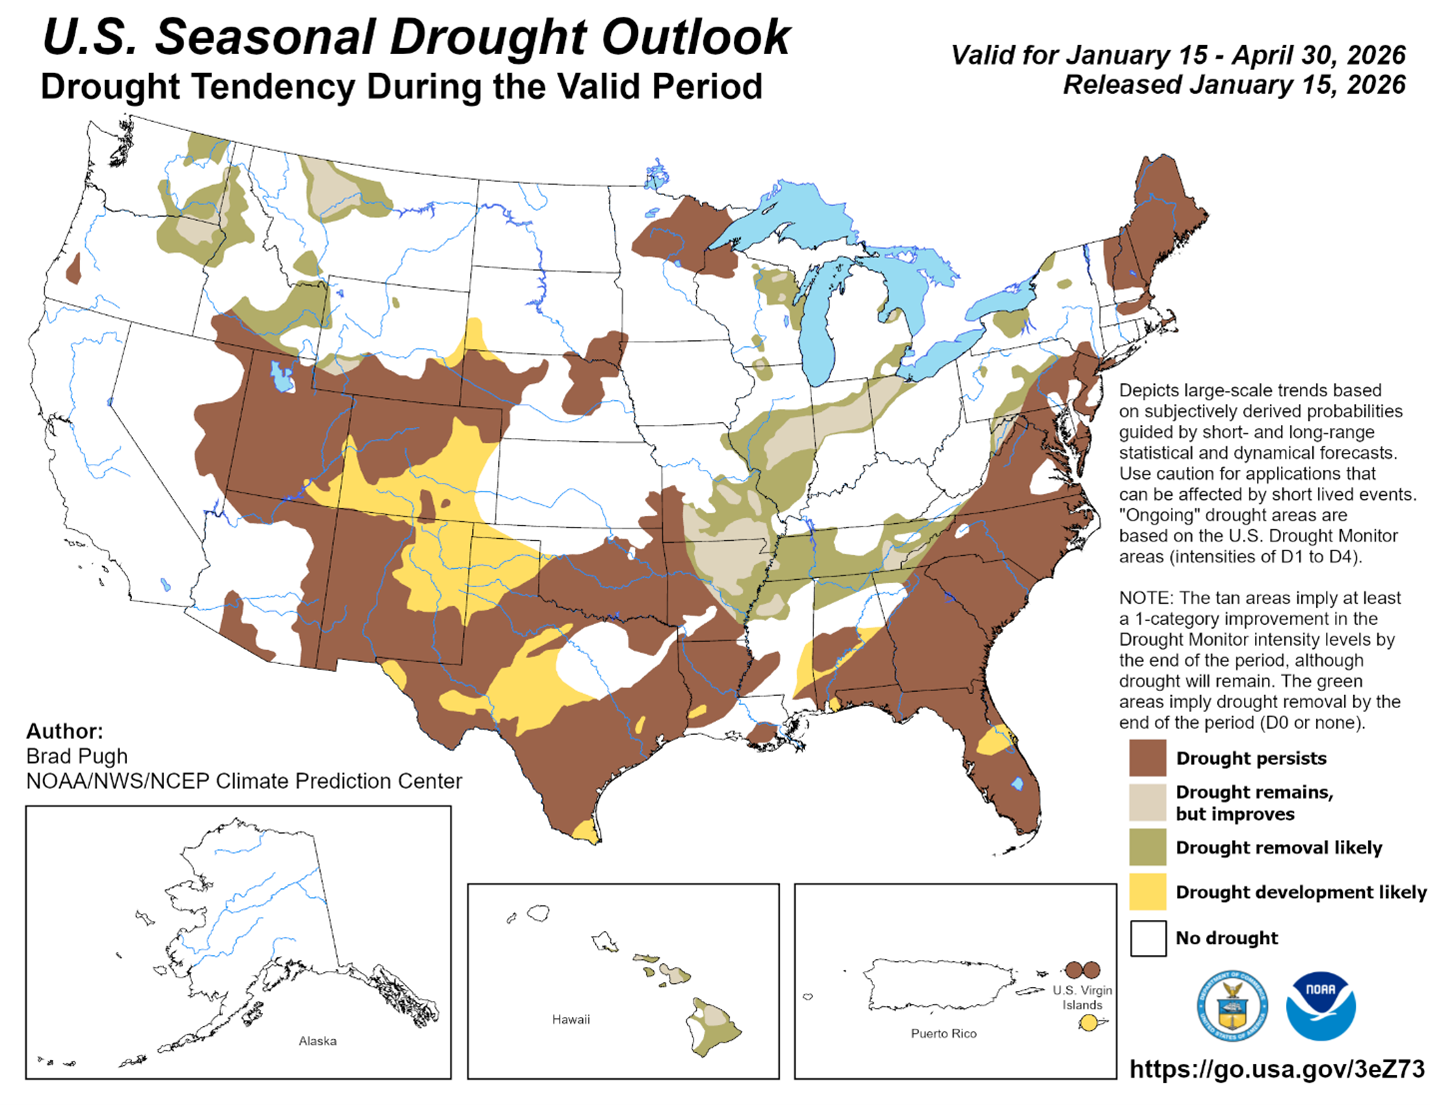
This seasonal drought outlook from January 15 to April 30th shows that most of Montana is out of a D1 drought status, with the central part of Montana, or the Golden Triangle, holding onto the drought condition status. The surrounding area, especially west of Great Falls, is likely to have a drought removal.
ENSO
 Graph from the Climate Prediction Center/NCEP/NWS.
As of January, La Niña remains, with a 75% chance of transitioning to ENSO-neutral during January-March 2026. ENSO-neutral is probable through at least the late spring of 2026 in the Northern Hemisphere.
Reference
Weather and climate forecasters use words and information in very particular ways that may be different from what we are accustomed to. Here is a list of terms we use in this newsletter:
![]() Weather and Climate — The difference between weather and climate is timescale. Weather is the day-to-day interaction of factors like temperature, humidity, precipitation, cloudiness, visibility, and wind. To understand climate at a given place requires looking at weather trends over relatively long periods of time—months, years, and decades. In addition to studying weather, scientists examine climate trends or cycles of variability to understand the bigger picture of long-term changes.
Weather and Climate — The difference between weather and climate is timescale. Weather is the day-to-day interaction of factors like temperature, humidity, precipitation, cloudiness, visibility, and wind. To understand climate at a given place requires looking at weather trends over relatively long periods of time—months, years, and decades. In addition to studying weather, scientists examine climate trends or cycles of variability to understand the bigger picture of long-term changes.
![]() Temperature and Precipitation — Throughout this newsletter, we report past temperature and precipitation data derived directly from the GridMET daily 4-km-gridded meteorological dataset from the University of Idaho. Temperature data are reported as seasonal averages; precipitation data are reported as seasonal total precipitation. Our three-month temperature and precipitation forecasts come from NOAA’s Climate Prediction Center.
Temperature and Precipitation — Throughout this newsletter, we report past temperature and precipitation data derived directly from the GridMET daily 4-km-gridded meteorological dataset from the University of Idaho. Temperature data are reported as seasonal averages; precipitation data are reported as seasonal total precipitation. Our three-month temperature and precipitation forecasts come from NOAA’s Climate Prediction Center.
![]() Climatologists use the term “normal” to compare current conditions or forecasts, such as temperature or precipitation, to the past. Here, the normal value is the statistical mean (the average) for a given measurement in a specific place during a specific period of time. Climatologists use the most recent 30-year period, rounded to the nearest decade, to define normal in North America: 1981–2010. The goal is to look far enough back in time to capture variation in weather patterns, but not so far as to be irrelevant to recent conditions. In 2026, we will start using the 1996–2026 period.
Climatologists use the term “normal” to compare current conditions or forecasts, such as temperature or precipitation, to the past. Here, the normal value is the statistical mean (the average) for a given measurement in a specific place during a specific period of time. Climatologists use the most recent 30-year period, rounded to the nearest decade, to define normal in North America: 1981–2010. The goal is to look far enough back in time to capture variation in weather patterns, but not so far as to be irrelevant to recent conditions. In 2026, we will start using the 1996–2026 period.
![]() La Niña/El Niño — El Niño and La Niña are the warm and cool phases of a recurring climate pattern across the tropical Pacific, the El Niño Southern Oscillation (ENSO). When ENSO is between warm and cool phases, conditions are called ENSO Neutral. ENSO is one of several global climate phenomena that affect Montana’s weather patterns, and ENSO conditions often guide seasonal climate projections for Montana. Current ENSO conditions and up-to-date projections are available on NOAA’s ENSO website.
La Niña/El Niño — El Niño and La Niña are the warm and cool phases of a recurring climate pattern across the tropical Pacific, the El Niño Southern Oscillation (ENSO). When ENSO is between warm and cool phases, conditions are called ENSO Neutral. ENSO is one of several global climate phenomena that affect Montana’s weather patterns, and ENSO conditions often guide seasonal climate projections for Montana. Current ENSO conditions and up-to-date projections are available on NOAA’s ENSO website.
![]() Snow Water Equivalent (SWE) — SWE is the amount of water contained within the snowpack. It can be thought of as the depth of water that would theoretically result if you melted the entire snowpack. SWE is measured across the West by the USDA Natural Resources Conservation Service’s SNOTEL network of snow monitoring stations. The SWE percent of normal represents the current snow water equivalent found at selected SNOTEL sites in the basin compared to the normal value for those sites from 1981–2010.
Snow Water Equivalent (SWE) — SWE is the amount of water contained within the snowpack. It can be thought of as the depth of water that would theoretically result if you melted the entire snowpack. SWE is measured across the West by the USDA Natural Resources Conservation Service’s SNOTEL network of snow monitoring stations. The SWE percent of normal represents the current snow water equivalent found at selected SNOTEL sites in the basin compared to the normal value for those sites from 1981–2010.
![]() Root Zone Soil Wetness — Root Zone Soil Wetness is a measure of how much water has saturated the soil. More specifically, it’s the relative saturation between completely dry (indicated by a 0) and completely saturated (indicated by a 1) between 0 and 100 cm depth. In the maps in this newsletter, soil saturation comes from NASA’s Soil Moisture Active Passive (SMAP) satellite program “SPL4SMGP” data product. Soil moisture is mapped using a combination of radar and radiometer measurements from space and surface observations at an approximately 9-km spatial resolution.
Root Zone Soil Wetness — Root Zone Soil Wetness is a measure of how much water has saturated the soil. More specifically, it’s the relative saturation between completely dry (indicated by a 0) and completely saturated (indicated by a 1) between 0 and 100 cm depth. In the maps in this newsletter, soil saturation comes from NASA’s Soil Moisture Active Passive (SMAP) satellite program “SPL4SMGP” data product. Soil moisture is mapped using a combination of radar and radiometer measurements from space and surface observations at an approximately 9-km spatial resolution.