Montana Drought & Climate — February 2026 Update
Intro
Here’s what you’ll find in this newsletter:
February Update — This update looks at how the winter has been progressing by sharing snowpack, precipitation, and temperature outlooks. This newsletter also gives a preview of what is predicted to happen in the coming months.
Reference — A helpful glossary of terms can be found at the bottom of this newsletter.
In Brief
- Drought conditions have degraded across the state.
- Record warmth throughout the state in February.
- Snowpack remains a bit below average for this time of year.
- Precipitation for most of the state was below normal.
February Report
Temperature
Montana Temperature Deviation
](/assets/posts/2026-03-11-mtdrought-and-climate-2026-February/images\mean_temp_anomaly_feb.png)
Warm temperatures across the state occurred throughout February. Most of the state has experienced a mean daily temperature of 8°F above normal.
On February 5th, 17 record-breaking temperatures were recorded across the state, with temperatures reaching 71°F in Great Falls.
These consistently warm temperatures have kept snowpack at mid and low elevations at a minimum. This continued pattern from January will have reduced the available snowpack for the upcoming spring. Additionally, these warm temperatures have melted the top soil layer in many locations across the state, unlocking moisture but increasing evaporation. Typically, the shallow soil layers remain frozen in February, keeping critical moisture stored until the spring thaw.
Seasonal Temperature Outlook
.](/assets/posts/2026-03-11-mtdrought-and-climate-2026-February/images/seasonal_temp_outlook_mar_may.gif)
The seasonal temperature outlook map for March through May carries these unseasonably warm February temperatures into the next few months, bringing these into the normal temperature ranges for the area this time of year. The temperature outlook gives us equal chances for temperatures above or below the seasonal normals for Montana.
Precipitation
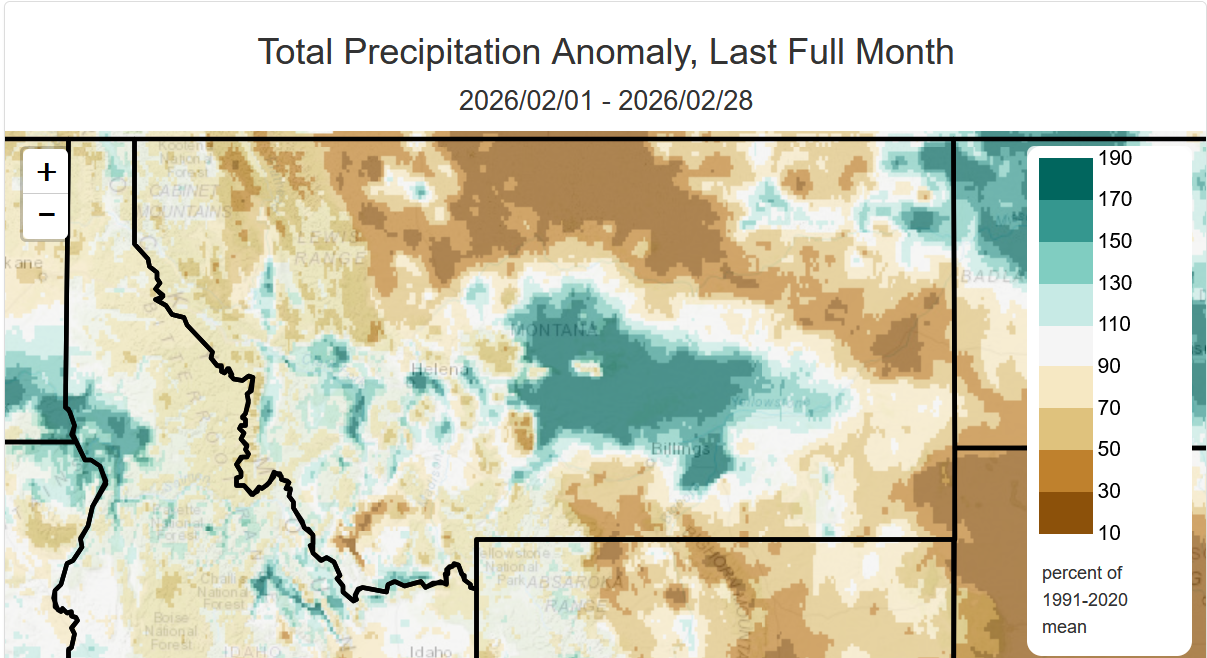
Most of Montana has received significantly below-normal precipitation, with only the central part of the state having a higher-than-average % of mean precipitation. Most of the precipitation that occurred has fallen as rain in lower elevations. This, along with unseasonably warm temperatures, can significantly impact spring runoff. Stay tuned, as the next few months will shed light on water availability, agricultural impacts, and water storage.
Seasonal Precipitation Outlook
.](/assets/posts/2026-03-11-mtdrought-and-climate-2026-February/images/seasonal_precip_outlook_mar_may.gif)
The seasonal precipitation outlook gives equal chances of below- or above-normal precipitation for March through May.
Snowpack
](/assets/posts/2026-03-11-mtdrought-and-climate-2026-February/images/SWE_NRCS_1991-2020_Median_February_28_2026.jpeg)
The trend of reduced precipitation and warmer temperatures has continued to keep the snowpack medians across the state below average, with most basins about 10-20% below the median SWE. The Bears Paw and the Tongue River basin’s have the lowest median SWE, at 48% and 56% respectively. The Upper Clark Fork, Upper Yellowstone, and Bighorn basin’s have medians near normal for this time of year. Low elevation SNOTEL sites have reported minimal snowpack due to warm temperatures. Multiple individual SNOTEL sites this month have recorded their lowest and second lowest snow depths on record. The status of the snowpack continues to indicate less than optimal water supply.
Drought
February USDM Status
](/assets/posts/2026-03-11-mtdrought-and-climate-2026-February/images/usdm_feb.png)
Extreme drought has risen to 4.2% of the state, with 13.6% in severe drought. This brings the total area in drought (D1-D4) to 56.1% of the state. Low snowpack, precipitation, and warm temperatures this month have continued to degrade conditions, particularly in the Golden Triangle region.
USDM 4 Week Class Change
](/assets/posts/2026-03-11-mtdrought-and-climate-2026-February/images/current_MT_chng_4W.png)
Most of Montana has had degradation of 1-class compared to the end of January, with the eastern part of the state going from no drought in January to abnormally dry and two class changes in the southeastern part of the state into moderate drought status.
Seasonal Drought Outlook (March - May 2026)
.](/assets/posts/2026-03-11-mtdrought-and-climate-2026-February/images/season_drought_feb28_may31.png)
The seasonal outlook for Montana has shifted from a potential improvement of conditions with a drought removal to drought persisting across the state, with most of the persistence occurring through central Montana.
ENSO
.](/assets/posts/2026-03-11-mtdrought-and-climate-2026-February/images/enso_probabilities.png)
The ENSO probabilities issued February 2026 are that La Niña persists, transitioning to ENSO neutral for the spring, with probabilities of El Niño dominance beginning in the summer months.
The Climate Prediction Center defines. . .
“El Niño conditions” as existing when:
- A one-month positive sea surface temperature anomaly of 0.5° C or greater is observed in the Niño-3.4 region of the equatorial Pacific Ocean (5° N - 5° S, 120° W - 170° W) and an expectation that the 3-month Oceanic Niño Index (ONI) threshold will be met, AND
- An atmospheric response typically associated with El Niño is observed over the equatorial Pacific Ocean (see The ENSO Cycle).
“La Niña conditions” as existing when:
- A one-month negative sea surface temperature anomaly of -0.5° C or less is observed in the Niño-3.4 region of the equatorial Pacific Ocean (5° N - 5° S, 120° W - 170° W) and an expectation that the 3-month Oceanic Niño Index (ONI) threshold will be met , AND
- An atmospheric response typically associated with La Niña is observed over the equatorial Pacific Ocean (see The ENSO Cycle).
Reference
Weather and climate forecasters use words and information in very particular ways that may be different from what we are accustomed to. Here is a list of terms we use in this newsletter:
![]() Weather and Climate — The difference between weather and climate is timescale. Weather is the day-to-day interaction of factors like temperature, humidity, precipitation, cloudiness, visibility, and wind. To understand climate at a given place requires looking at weather trends over relatively long periods of time—months, years, and decades. In addition to studying weather, scientists examine climate trends or cycles of variability to understand the bigger picture of long-term changes.
Weather and Climate — The difference between weather and climate is timescale. Weather is the day-to-day interaction of factors like temperature, humidity, precipitation, cloudiness, visibility, and wind. To understand climate at a given place requires looking at weather trends over relatively long periods of time—months, years, and decades. In addition to studying weather, scientists examine climate trends or cycles of variability to understand the bigger picture of long-term changes.
![]() Temperature and Precipitation — Throughout this newsletter, we report past temperature and precipitation data derived directly from the GridMET daily 4-km-gridded meteorological dataset from the University of Idaho. Temperature data are reported as seasonal averages; precipitation data are reported as seasonal total precipitation. Our three-month temperature and precipitation forecasts come from NOAA’s Climate Prediction Center.
Temperature and Precipitation — Throughout this newsletter, we report past temperature and precipitation data derived directly from the GridMET daily 4-km-gridded meteorological dataset from the University of Idaho. Temperature data are reported as seasonal averages; precipitation data are reported as seasonal total precipitation. Our three-month temperature and precipitation forecasts come from NOAA’s Climate Prediction Center.
![]() Climatologists use the term “normal” to compare current conditions or forecasts, such as temperature or precipitation, to the past. Here, the normal value is the statistical mean (the average) for a given measurement in a specific place during a specific period of time. Climatologists use the most recent 30-year period, rounded to the nearest decade, to define normal in North America: 1981–2010. The goal is to look far enough back in time to capture variation in weather patterns, but not so far as to be irrelevant to recent conditions. In 2026, we will start using the 1996–2026 period.
Climatologists use the term “normal” to compare current conditions or forecasts, such as temperature or precipitation, to the past. Here, the normal value is the statistical mean (the average) for a given measurement in a specific place during a specific period of time. Climatologists use the most recent 30-year period, rounded to the nearest decade, to define normal in North America: 1981–2010. The goal is to look far enough back in time to capture variation in weather patterns, but not so far as to be irrelevant to recent conditions. In 2026, we will start using the 1996–2026 period.
![]() La Niña/El Niño — El Niño and La Niña are the warm and cool phases of a recurring climate pattern across the tropical Pacific, the El Niño Southern Oscillation (ENSO). When ENSO is between warm and cool phases, conditions are called ENSO Neutral. ENSO is one of several global climate phenomena that affect Montana’s weather patterns, and ENSO conditions often guide seasonal climate projections for Montana. Current ENSO conditions and up-to-date projections are available on NOAA’s ENSO website.
La Niña/El Niño — El Niño and La Niña are the warm and cool phases of a recurring climate pattern across the tropical Pacific, the El Niño Southern Oscillation (ENSO). When ENSO is between warm and cool phases, conditions are called ENSO Neutral. ENSO is one of several global climate phenomena that affect Montana’s weather patterns, and ENSO conditions often guide seasonal climate projections for Montana. Current ENSO conditions and up-to-date projections are available on NOAA’s ENSO website.
![]() Snow Water Equivalent (SWE) — SWE is the amount of water contained within the snowpack. It can be thought of as the depth of water that would theoretically result if you melted the entire snowpack. SWE is measured across the West by the USDA Natural Resources Conservation Service’s SNOTEL network of snow monitoring stations. The SWE percent of normal represents the current snow water equivalent found at selected SNOTEL sites in the basin compared to the normal value for those sites from 1981–2010.
Snow Water Equivalent (SWE) — SWE is the amount of water contained within the snowpack. It can be thought of as the depth of water that would theoretically result if you melted the entire snowpack. SWE is measured across the West by the USDA Natural Resources Conservation Service’s SNOTEL network of snow monitoring stations. The SWE percent of normal represents the current snow water equivalent found at selected SNOTEL sites in the basin compared to the normal value for those sites from 1981–2010.
![]() Root Zone Soil Wetness — Root Zone Soil Wetness is a measure of how much water has saturated the soil. More specifically, it’s the relative saturation between completely dry (indicated by a 0) and completely saturated (indicated by a 1) between 0 and 100 cm depth. In the maps in this newsletter, soil saturation comes from NASA’s Soil Moisture Active Passive (SMAP) satellite program “SPL4SMGP” data product. Soil moisture is mapped using a combination of radar and radiometer measurements from space and surface observations at an approximately 9-km spatial resolution.
Root Zone Soil Wetness — Root Zone Soil Wetness is a measure of how much water has saturated the soil. More specifically, it’s the relative saturation between completely dry (indicated by a 0) and completely saturated (indicated by a 1) between 0 and 100 cm depth. In the maps in this newsletter, soil saturation comes from NASA’s Soil Moisture Active Passive (SMAP) satellite program “SPL4SMGP” data product. Soil moisture is mapped using a combination of radar and radiometer measurements from space and surface observations at an approximately 9-km spatial resolution.