Montana Drought & Climate — May Update
MDC Newsletter May Update
 Our crew working at a build site in 2025.
Here’s what you’ll find in the May newsletter:
- Update about our 2026 build season!
- Our precipitation and temperature outlooks for the summer.
- Our coverage of the windstorm and major rain event.
- Links to our social media.
MCO Update
-
Follow our social media pages for all your MCO updates and news! Our Linktree.
-
Our crews are on the road! The Montana Climate Office’s 2026 build season is officially underway. The crews are starting in Dillon and Laurin, then moving all the way west towards Ekalaka and Belltower. We will be posting on social media when every new station comes online this season. Stay tuned for when the stations are activated!
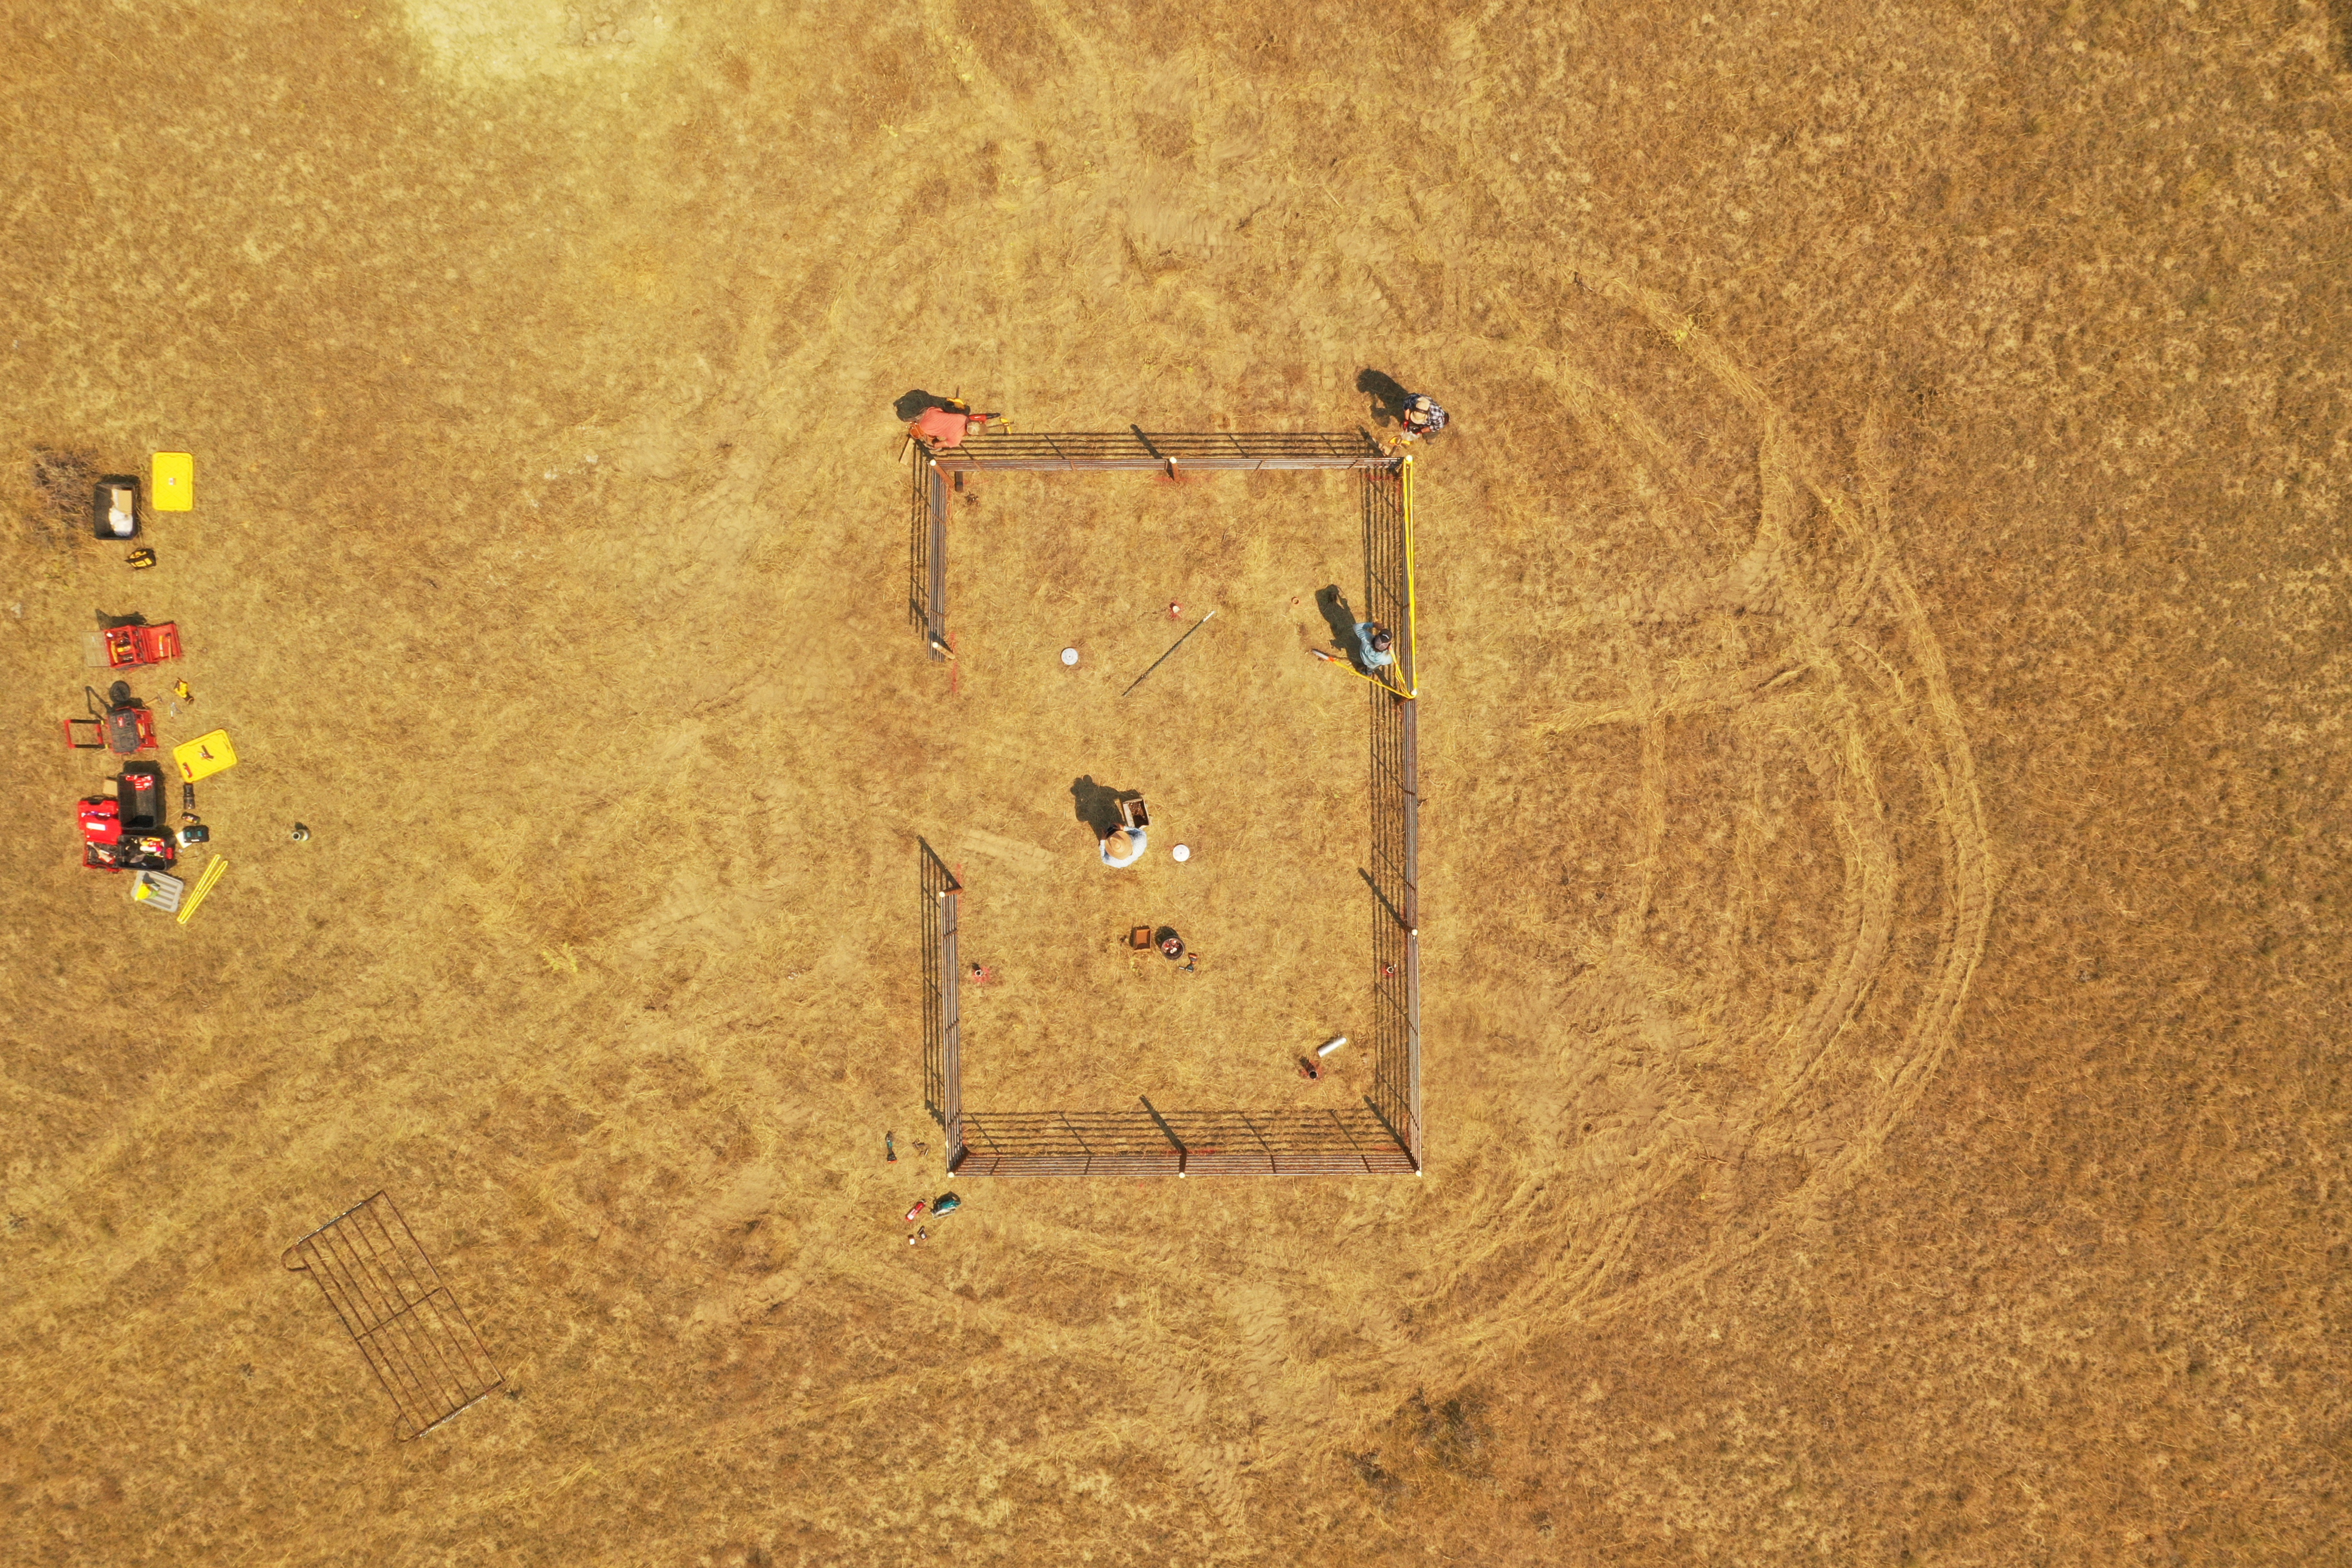 Our ground team builds a fence at the Mosby SE station in 2025.
We divide our build crews into three teams: The Ground team preps the site by building fences, digging the soil pit, and laying down the station base; the Structures team stands up and secures our station towers; and the Tech team sets up all the instrumentation and wiring for the logger box. We then run a series of QA/QC checks with our servers and get our stations activated!
In Brief
- Temperatures were above average for the month of May!
- The month was a dry one, except for the large low-pressure system at the end of the month that brought significant precipitation to the state.
- Streamflow hydrology was complex, with the end-of-month storm spiking streamflow levels.
May Report
Temperature
Montana Temperature Deviation
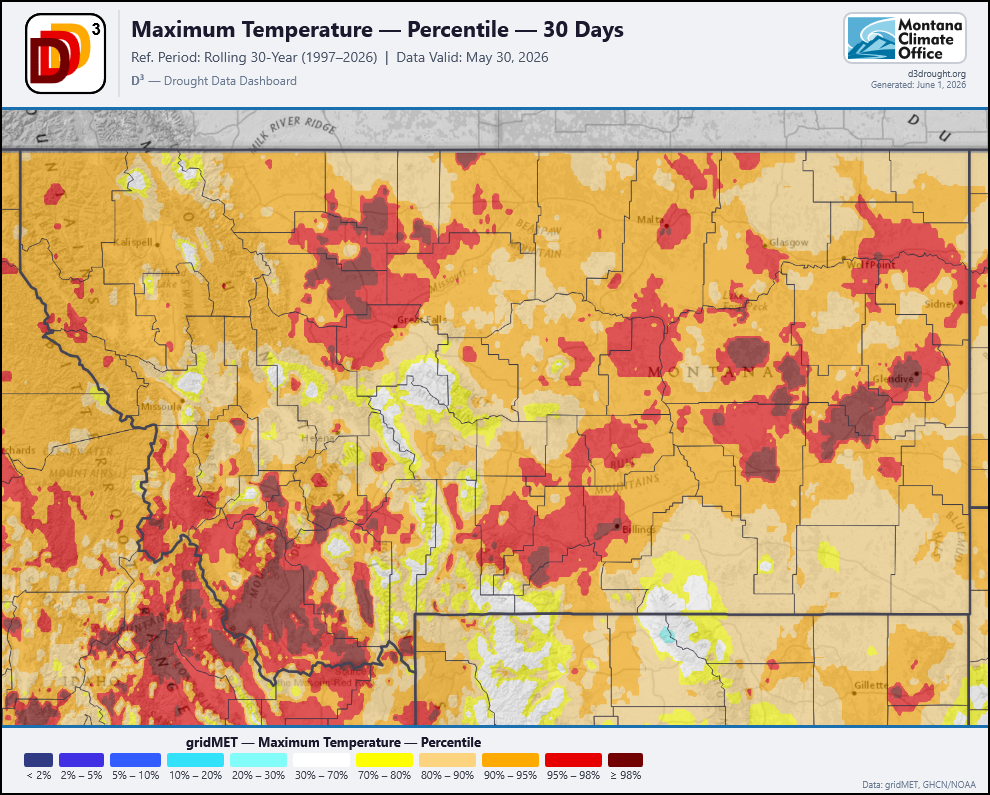
Source: Drought Data Dashboard.
This month has been warm across the state, with above-normal temperatures. A heat wave that hit later in May east of the continental divide brought temperatures continuously into the high 80s and even into the 90s.
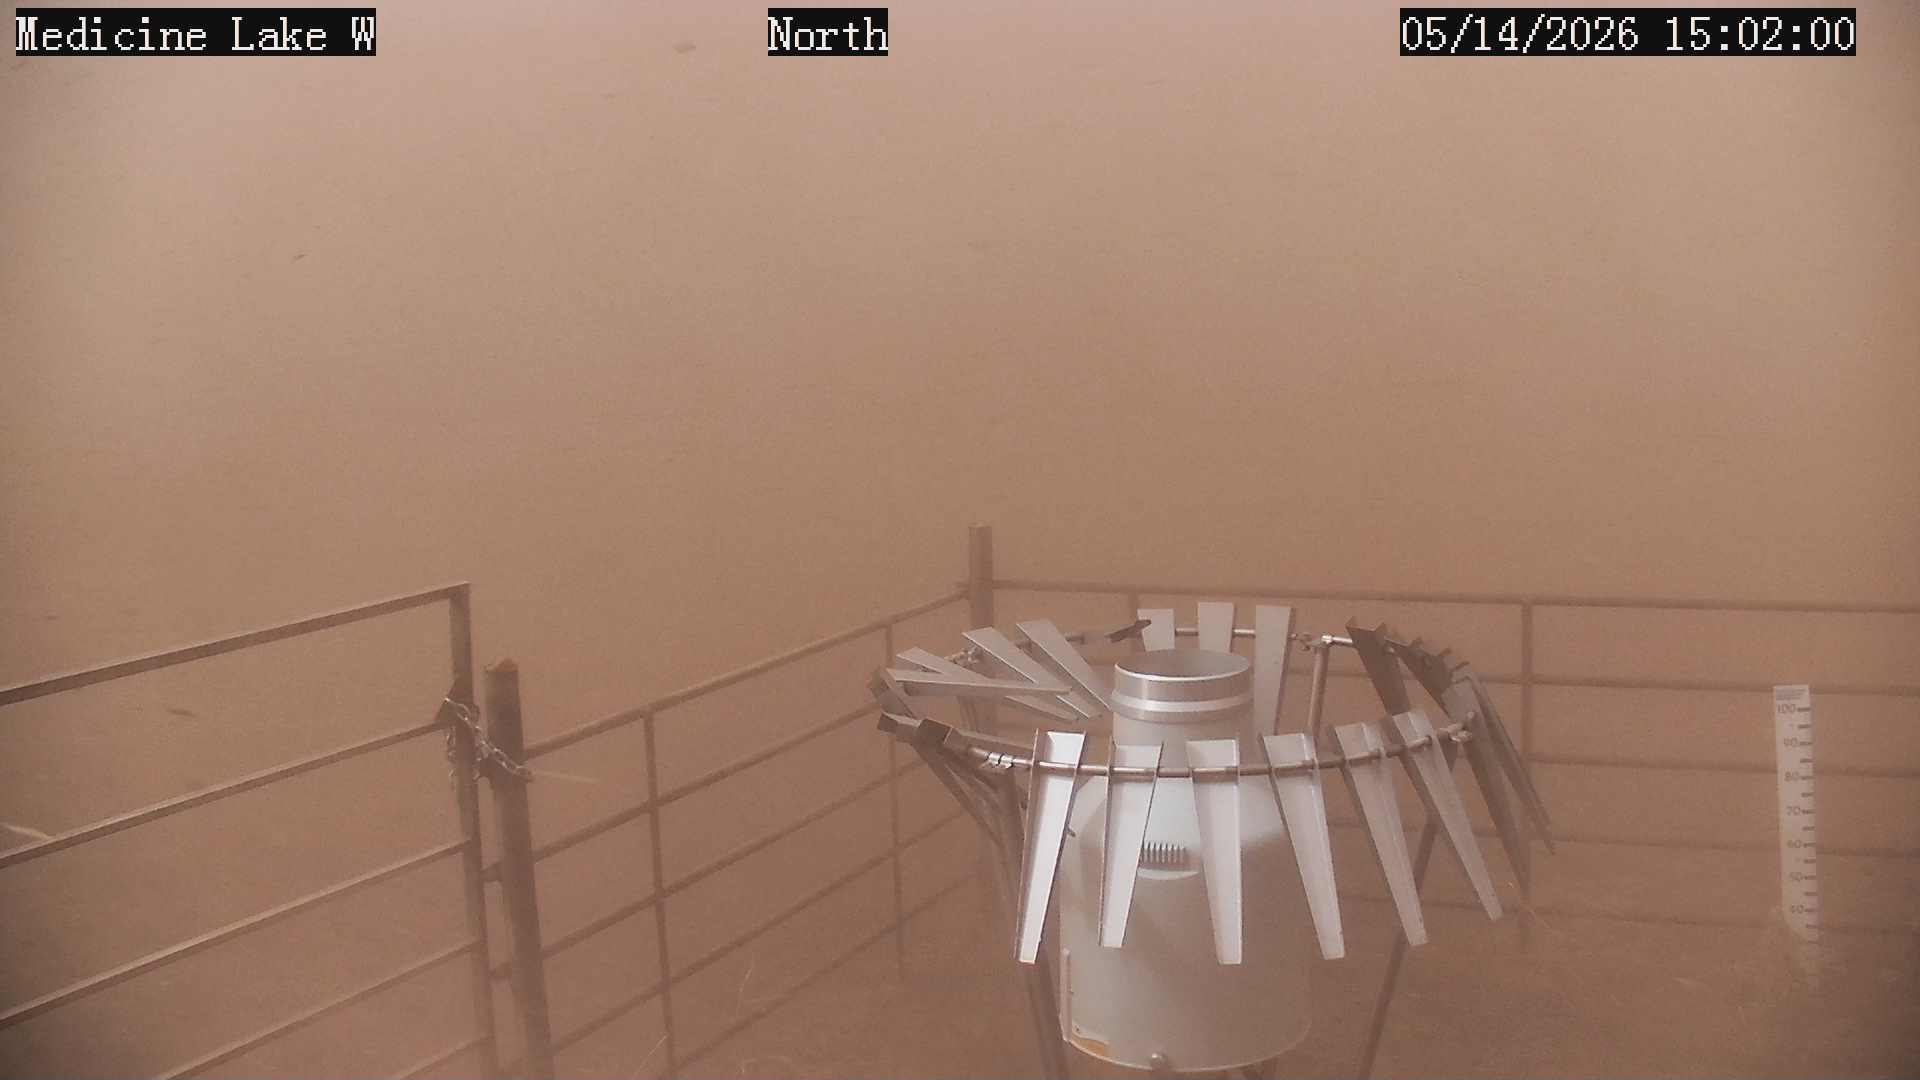
One station representative of some of the more intense weather we have had in the northeastern part of the state is Medicine Lake W. This station reported high temperatures in the 90’s and was hit by a severe windstorm on May 14th. Read our post about it below!
Disastrous Windstorm Across Montana’s Hi-Line Impacts Producers
Seasonal Temperature Outlook (JJA)
 Source: Climate Prediction Center.
Montana is likely to experience above-normal temperatures this summer. The western part of the state is more likely to experience abnormally hot temperatures.
Precipitation
Montana Precipitation Deviation
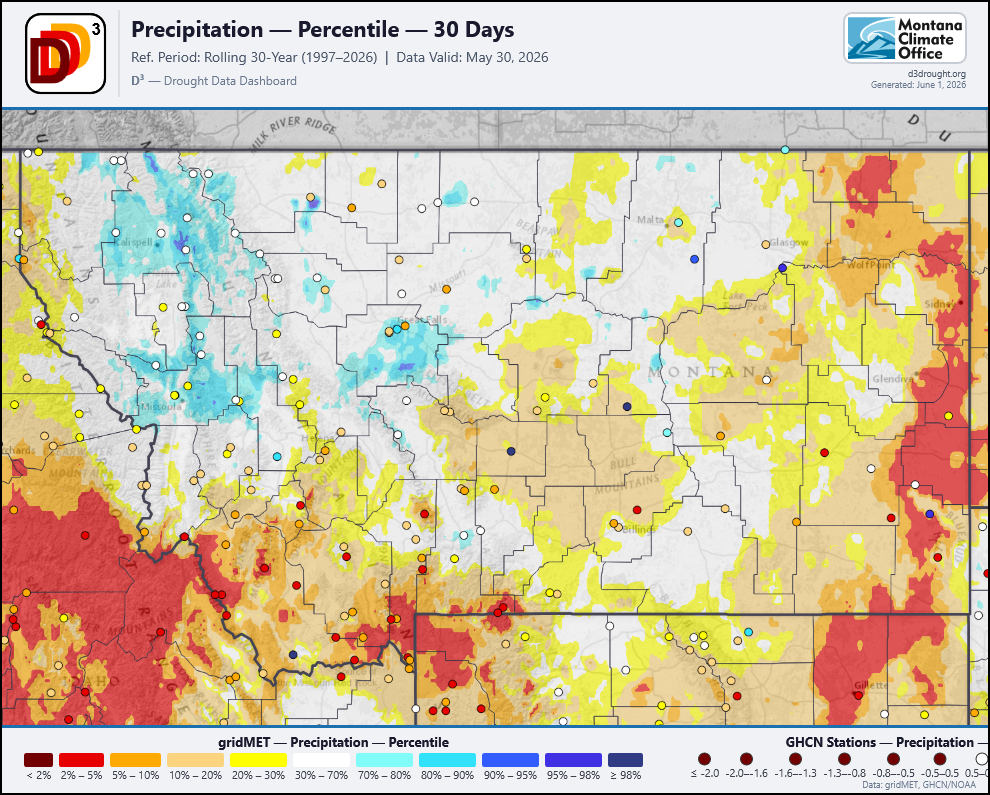
Source: Drought Data Dashboard.
The month of May had relatively little precipitation across the state, but the end of the month brought a slow-moving low-pressure system that provided precipitation for the entire state, with some locations receiving record-breaking amounts of rain.
Seasonal Precipitation Outlook (JJA)
 Source: NOAA.
Montana has an equal chance of having near-normal precipitation this summer. The northwestern part of the state is leaning below normal for seasonal precipitation (33-44%).
End of May Storm
Check out our press release about the precipitation event that happened over May 30th to June 2nd. This storm brought significant rain to most of the state. Read through to look at precipitation totals, SPI impacts, and how basin streamflows reacted to this event.
Snowpack
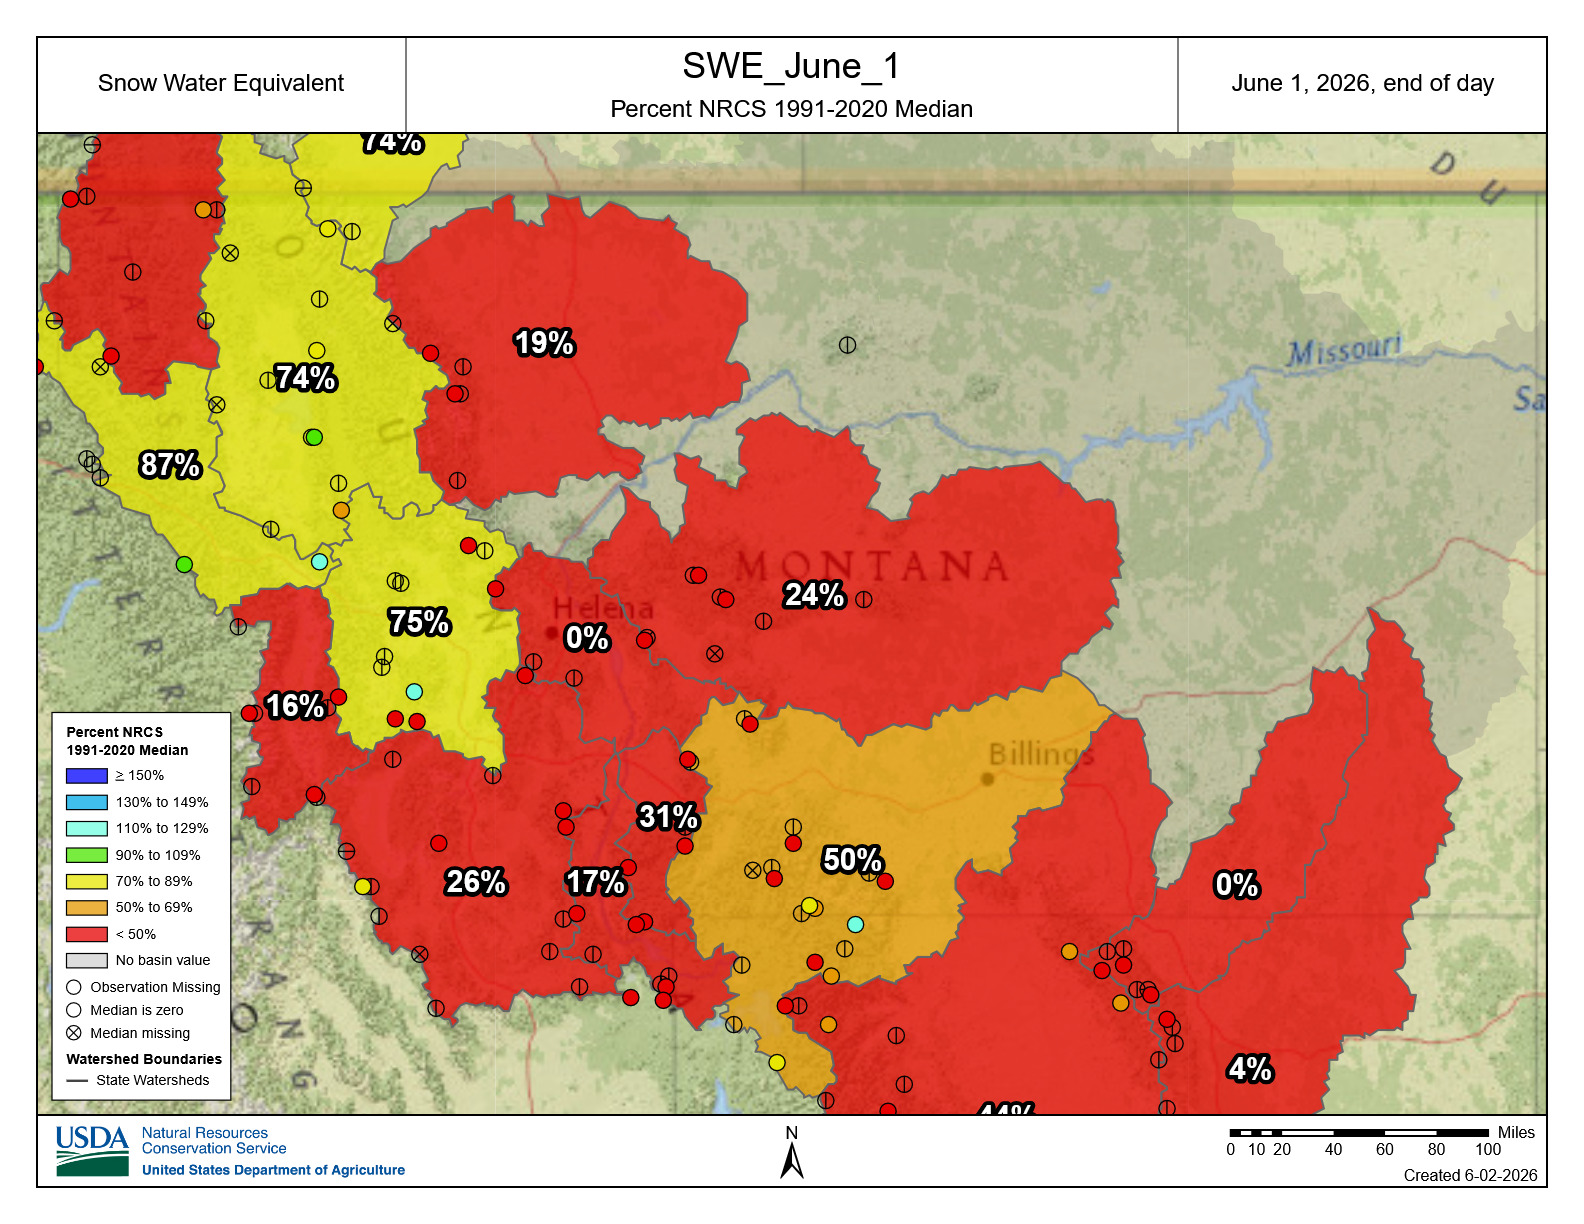 Source: USDA Snow and Water Interactive Map.
Snowpack in Montana started below normal on May 1st and has melted out at many higher-elevation SNOTEL sites that were holding onto snow, with SWE values now below 30%. Only western Montana’s basins have SWE at 70% or higher. Notably, the state has held onto its snowpack longer than any other state in the West and the Rocky Mountain area. This could provide a protective effect against wildfire compared to the rest of the West, where the meager snowpack melted out over the last few months.
Streamflow
.png) Source: Drought Data Dashboard.
Source: Drought Data Dashboard.
Streamflow conditions changed throughout the month, starting with 30-year minimums across the central part of the state into the southeast, and in the northeast, with percentiles below 20%. The month continued to have typical percentiles for the west. The dry, hot weather at the end of the month lowered streamflow basins in the northeast. At the end of the month, the low-pressure system that produced significant rainfall, pushed streamflow percentiles for most basins into much higher categories, with 4+ inches in the Mission Mountains pushing streamflow into the 30-year maximums and triggering flood warnings in those river systems.
Drought
USDM Status
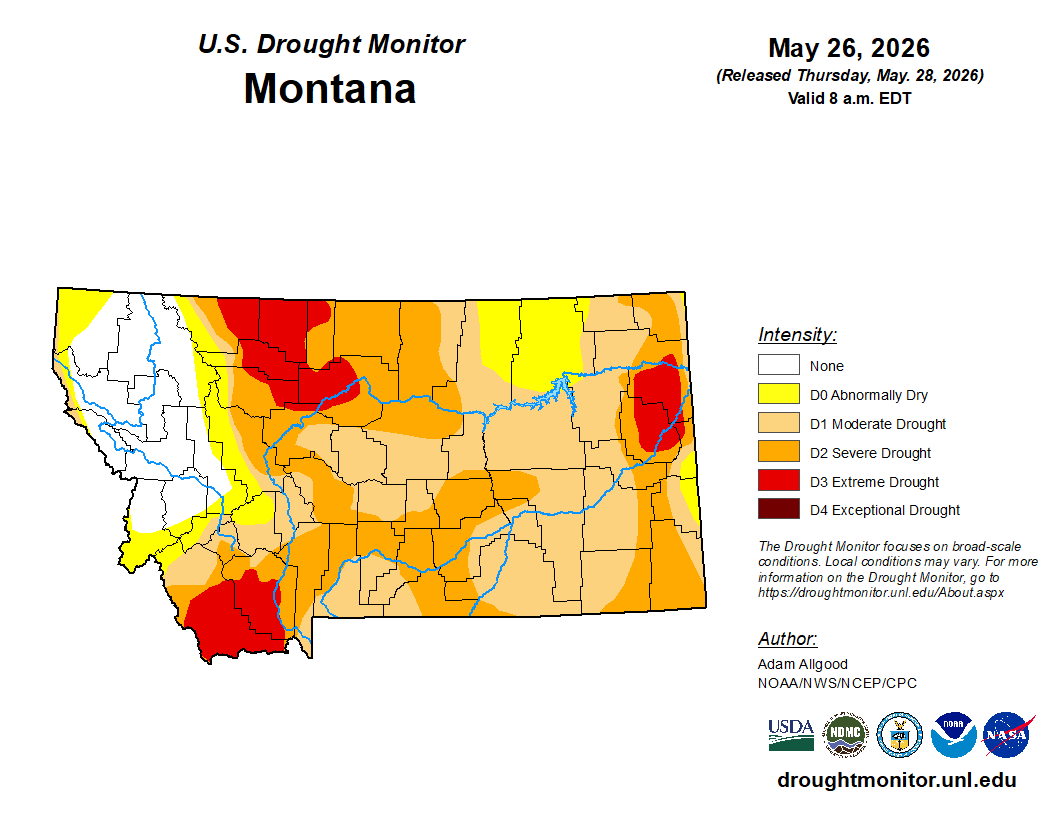 Source: USDM Montana Map.
Montana remains one of the only western states that has not declared a state of emergency for drought.
The eastern part of the state has had conditions deteriorate with the hot, dry, and windy weather increasing evaporative demand, that put the intensity from abnormally dry in the beginning of the month into extreme drought conditions in Richland and Dawson counties. Extreme drought conditions have extended farther into Beaverhead County.
USDM 4 Week Class Change
 Source: Four-week Change Map.
Northwestern Montana has showed an entire class improvement into conditions that are normal, extending these good conditions across most of that part of the state.
Seasonal Drought Outlook (JJA)
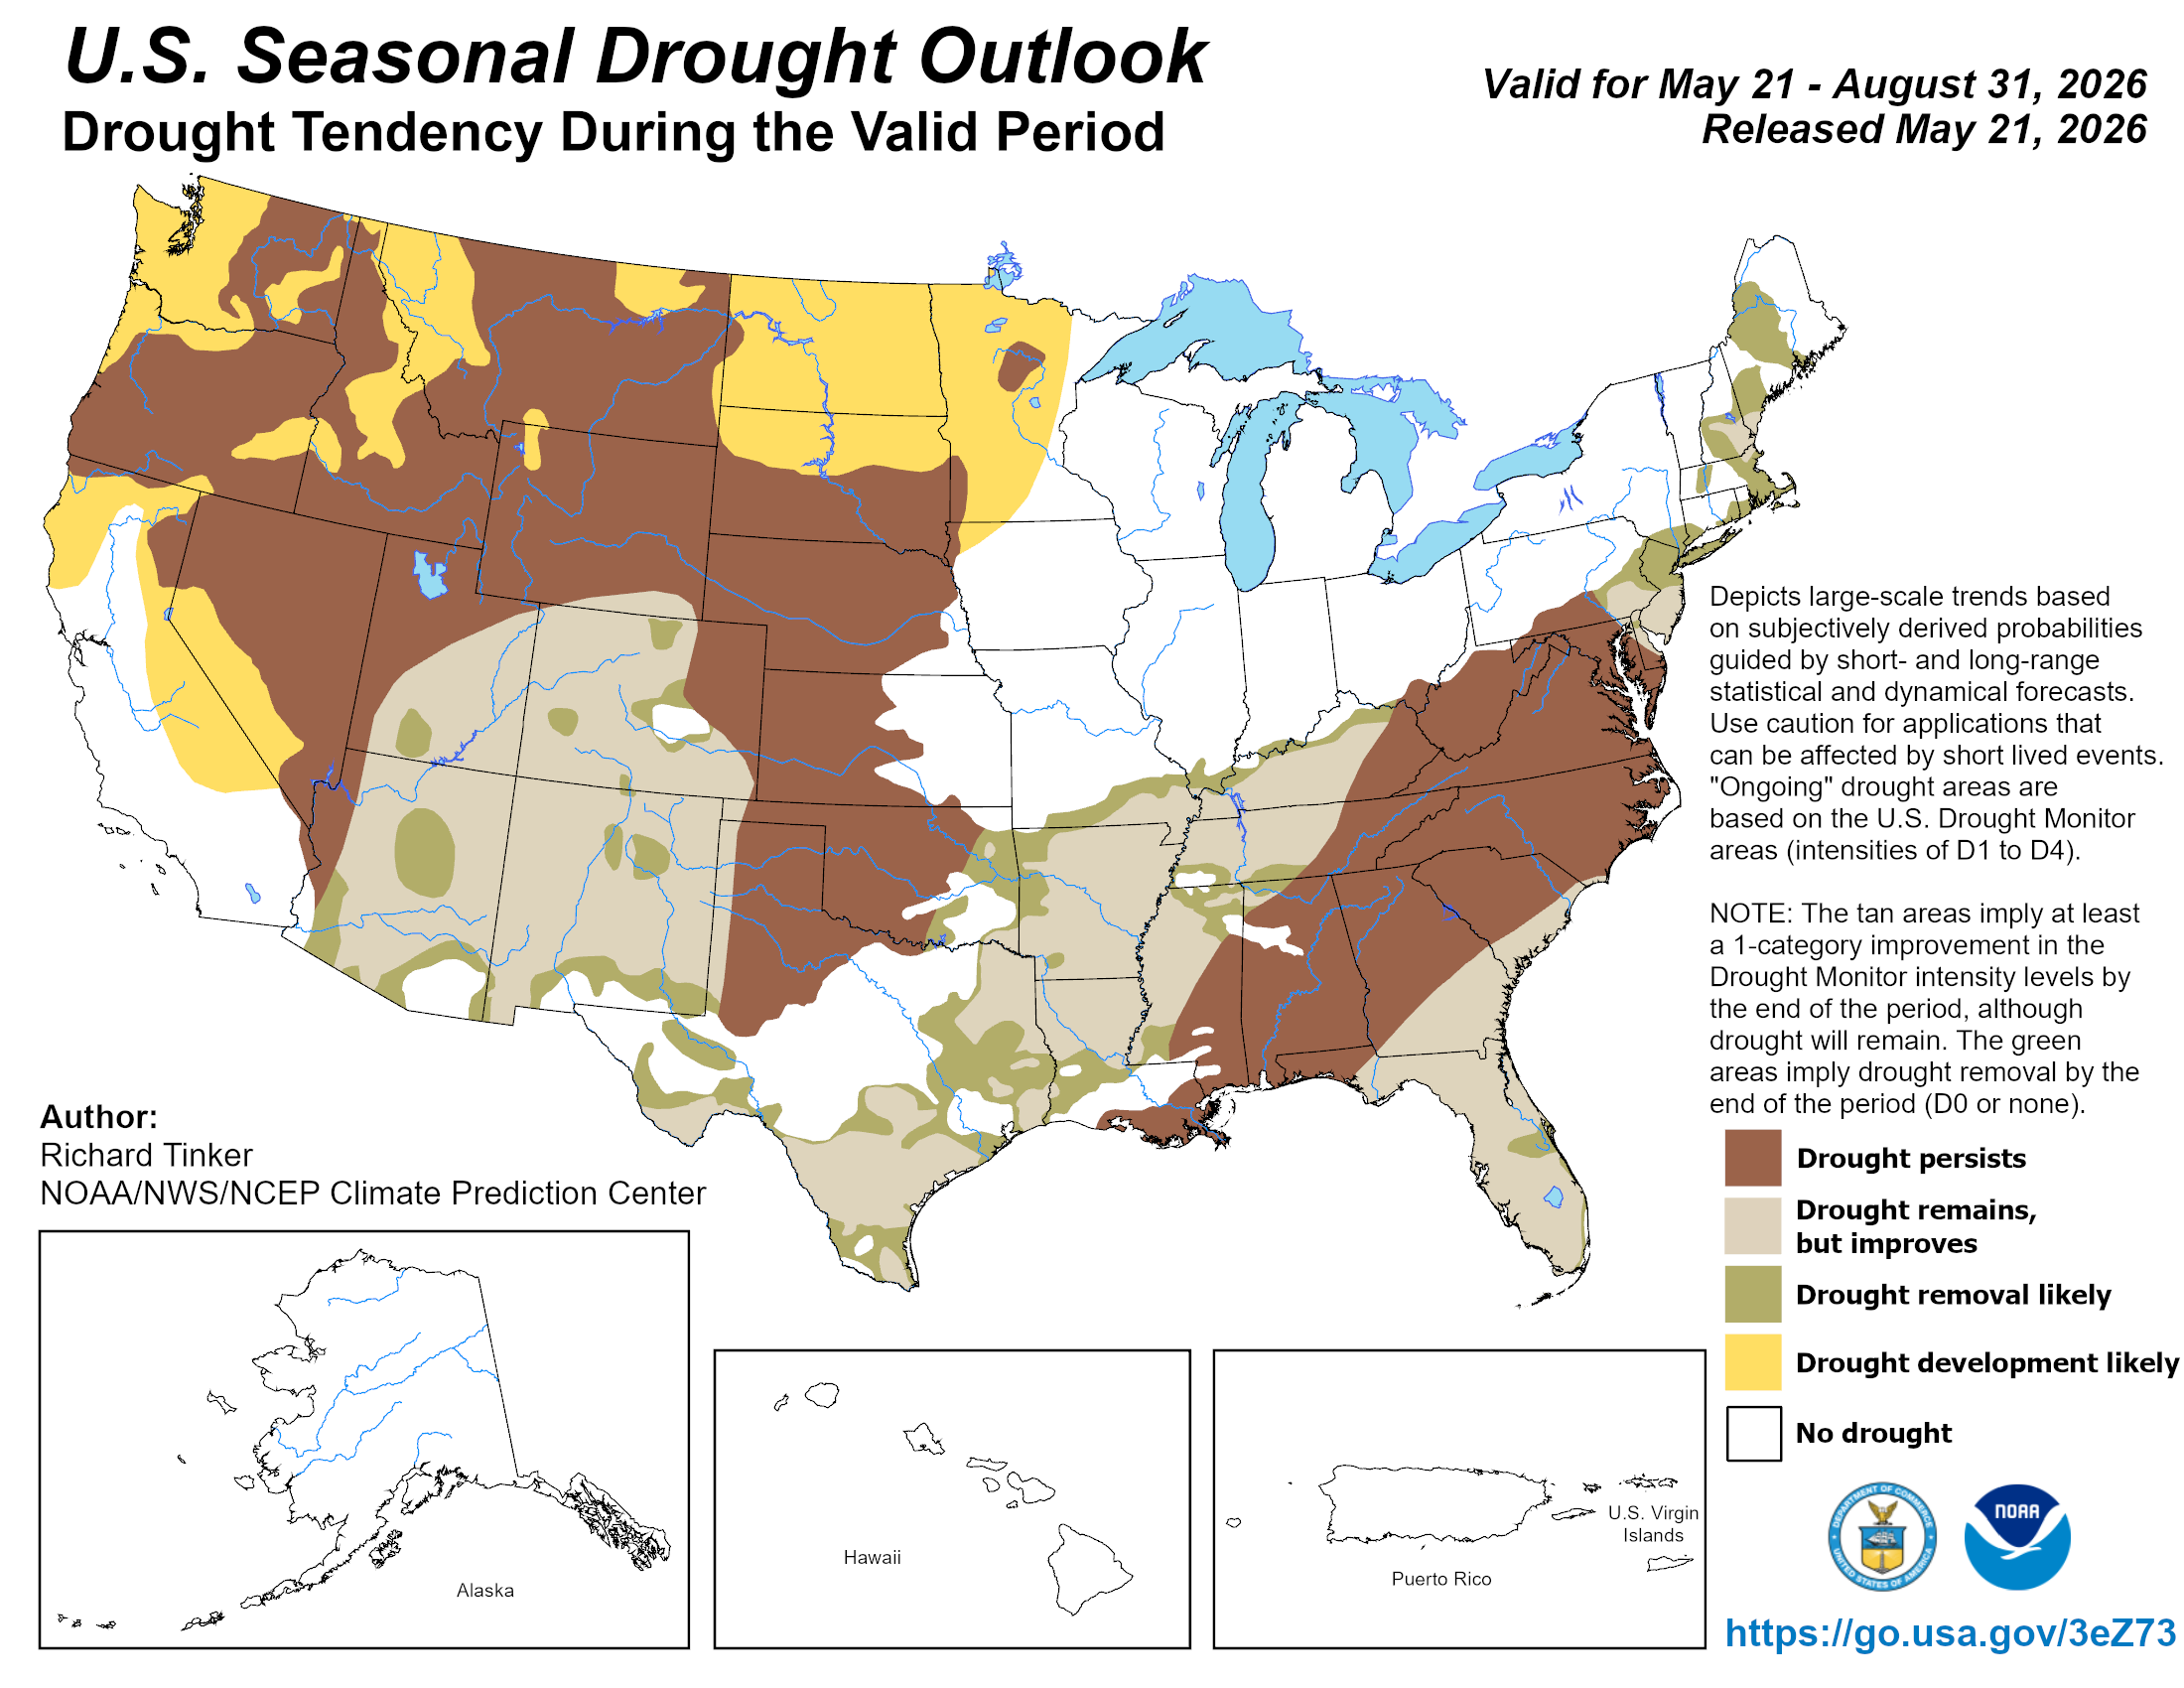 Source: NOAA Drought Outlook Map.
Drought continues to persist across the state, with drought development likely during the summer months. It remains to be seen how much this beneficial rain system will delay the onset of abnormally dry and drought conditions in Montana.
ENSO
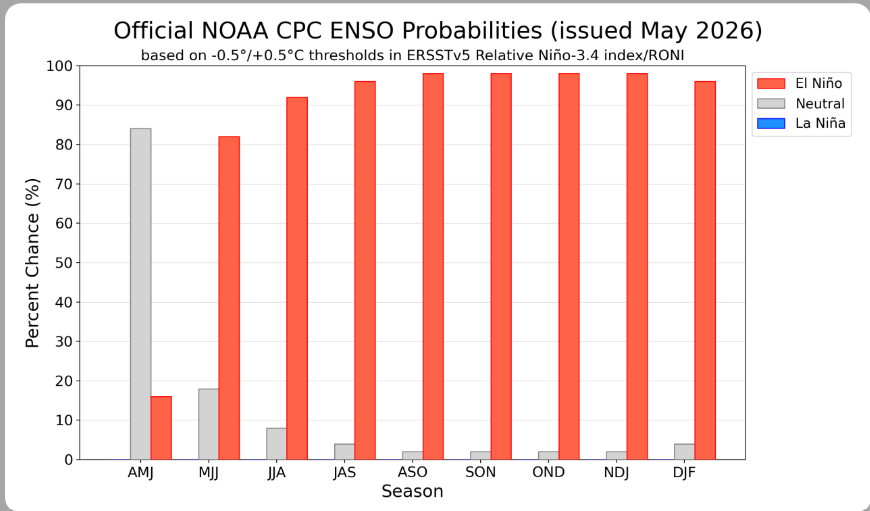 Source: Climate Prediction Center.
The CPC issued an El Niño Watch: Issued when conditions are favorable for the development of El Niño conditions within the next six months.
We are currently in ENSO-neutral conditions. El Niño is likely to develop (82% chance) this summer and persist through early 2027. Source: the Climate Prediction Center/NCEP/NWS.
Reference
![]() Weather and Climate — The difference between weather and climate is timescale. Weather is the day-to-day interaction of factors like temperature, humidity, precipitation, cloudiness, visibility, and wind. To understand climate at a given place requires looking at weather trends over relatively long periods of time—months, years, and decades. In addition to studying weather, scientists examine climate trends or cycles of variability to understand the bigger picture of long-term changes.
Weather and Climate — The difference between weather and climate is timescale. Weather is the day-to-day interaction of factors like temperature, humidity, precipitation, cloudiness, visibility, and wind. To understand climate at a given place requires looking at weather trends over relatively long periods of time—months, years, and decades. In addition to studying weather, scientists examine climate trends or cycles of variability to understand the bigger picture of long-term changes.
![]() Temperature and Precipitation — Throughout this newsletter, we report past temperature and precipitation data derived directly from the GridMET daily 4-km-gridded meteorological dataset from the University of Idaho. Temperature data are reported as seasonal averages; precipitation data are reported as seasonal total precipitation. Our three-month temperature and precipitation forecasts come from NOAA’s Climate Prediction Center.
Temperature and Precipitation — Throughout this newsletter, we report past temperature and precipitation data derived directly from the GridMET daily 4-km-gridded meteorological dataset from the University of Idaho. Temperature data are reported as seasonal averages; precipitation data are reported as seasonal total precipitation. Our three-month temperature and precipitation forecasts come from NOAA’s Climate Prediction Center.
![]() Climatologists use the term “normal” to compare current conditions or forecasts, such as temperature or precipitation, to the past. Here, the normal value is the statistical mean (the average) for a given measurement in a specific place during a specific period of time. Climatologists use the most recent 30-year period, rounded to the nearest decade, to define normal in North America: 1981–2010. The goal is to look far enough back in time to capture variation in weather patterns, but not so far as to be irrelevant to recent conditions. In 2026, we will start using the 1996–2026 period.
Climatologists use the term “normal” to compare current conditions or forecasts, such as temperature or precipitation, to the past. Here, the normal value is the statistical mean (the average) for a given measurement in a specific place during a specific period of time. Climatologists use the most recent 30-year period, rounded to the nearest decade, to define normal in North America: 1981–2010. The goal is to look far enough back in time to capture variation in weather patterns, but not so far as to be irrelevant to recent conditions. In 2026, we will start using the 1996–2026 period.
![]() La Niña/El Niño — El Niño and La Niña are the warm and cool phases of a recurring climate pattern across the tropical Pacific, the El Niño Southern Oscillation (ENSO). When ENSO is between warm and cool phases, conditions are called ENSO Neutral. ENSO is one of several global climate phenomena that affect Montana’s weather patterns, and ENSO conditions often guide seasonal climate projections for Montana. Current ENSO conditions and up-to-date projections are available on NOAA’s ENSO website.
La Niña/El Niño — El Niño and La Niña are the warm and cool phases of a recurring climate pattern across the tropical Pacific, the El Niño Southern Oscillation (ENSO). When ENSO is between warm and cool phases, conditions are called ENSO Neutral. ENSO is one of several global climate phenomena that affect Montana’s weather patterns, and ENSO conditions often guide seasonal climate projections for Montana. Current ENSO conditions and up-to-date projections are available on NOAA’s ENSO website.
![]() Snow Water Equivalent (SWE) — SWE is the amount of water contained within the snowpack. It can be thought of as the depth of water that would theoretically result if you melted the entire snowpack. SWE is measured across the West by the USDA Natural Resources Conservation Service’s SNOTEL network of snow monitoring stations. The SWE percent of normal represents the current snow water equivalent found at selected SNOTEL sites in the basin compared to the normal value for those sites from 1981–2010.
Snow Water Equivalent (SWE) — SWE is the amount of water contained within the snowpack. It can be thought of as the depth of water that would theoretically result if you melted the entire snowpack. SWE is measured across the West by the USDA Natural Resources Conservation Service’s SNOTEL network of snow monitoring stations. The SWE percent of normal represents the current snow water equivalent found at selected SNOTEL sites in the basin compared to the normal value for those sites from 1981–2010.
![]() Root Zone Soil Wetness — Root Zone Soil Wetness is a measure of how much water has saturated the soil. More specifically, it’s the relative saturation between completely dry (indicated by a 0) and completely saturated (indicated by a 1) between 0 and 100 cm depth. In the maps in this newsletter, soil saturation comes from NASA’s Soil Moisture Active Passive (SMAP) satellite program “SPL4SMGP” data product. Soil moisture is mapped using a combination of radar and radiometer measurements from space and surface observations at an approximately 9-km spatial resolution.
Root Zone Soil Wetness — Root Zone Soil Wetness is a measure of how much water has saturated the soil. More specifically, it’s the relative saturation between completely dry (indicated by a 0) and completely saturated (indicated by a 1) between 0 and 100 cm depth. In the maps in this newsletter, soil saturation comes from NASA’s Soil Moisture Active Passive (SMAP) satellite program “SPL4SMGP” data product. Soil moisture is mapped using a combination of radar and radiometer measurements from space and surface observations at an approximately 9-km spatial resolution.