Montana Drought & Climate — June Update
MDC June Newsletter
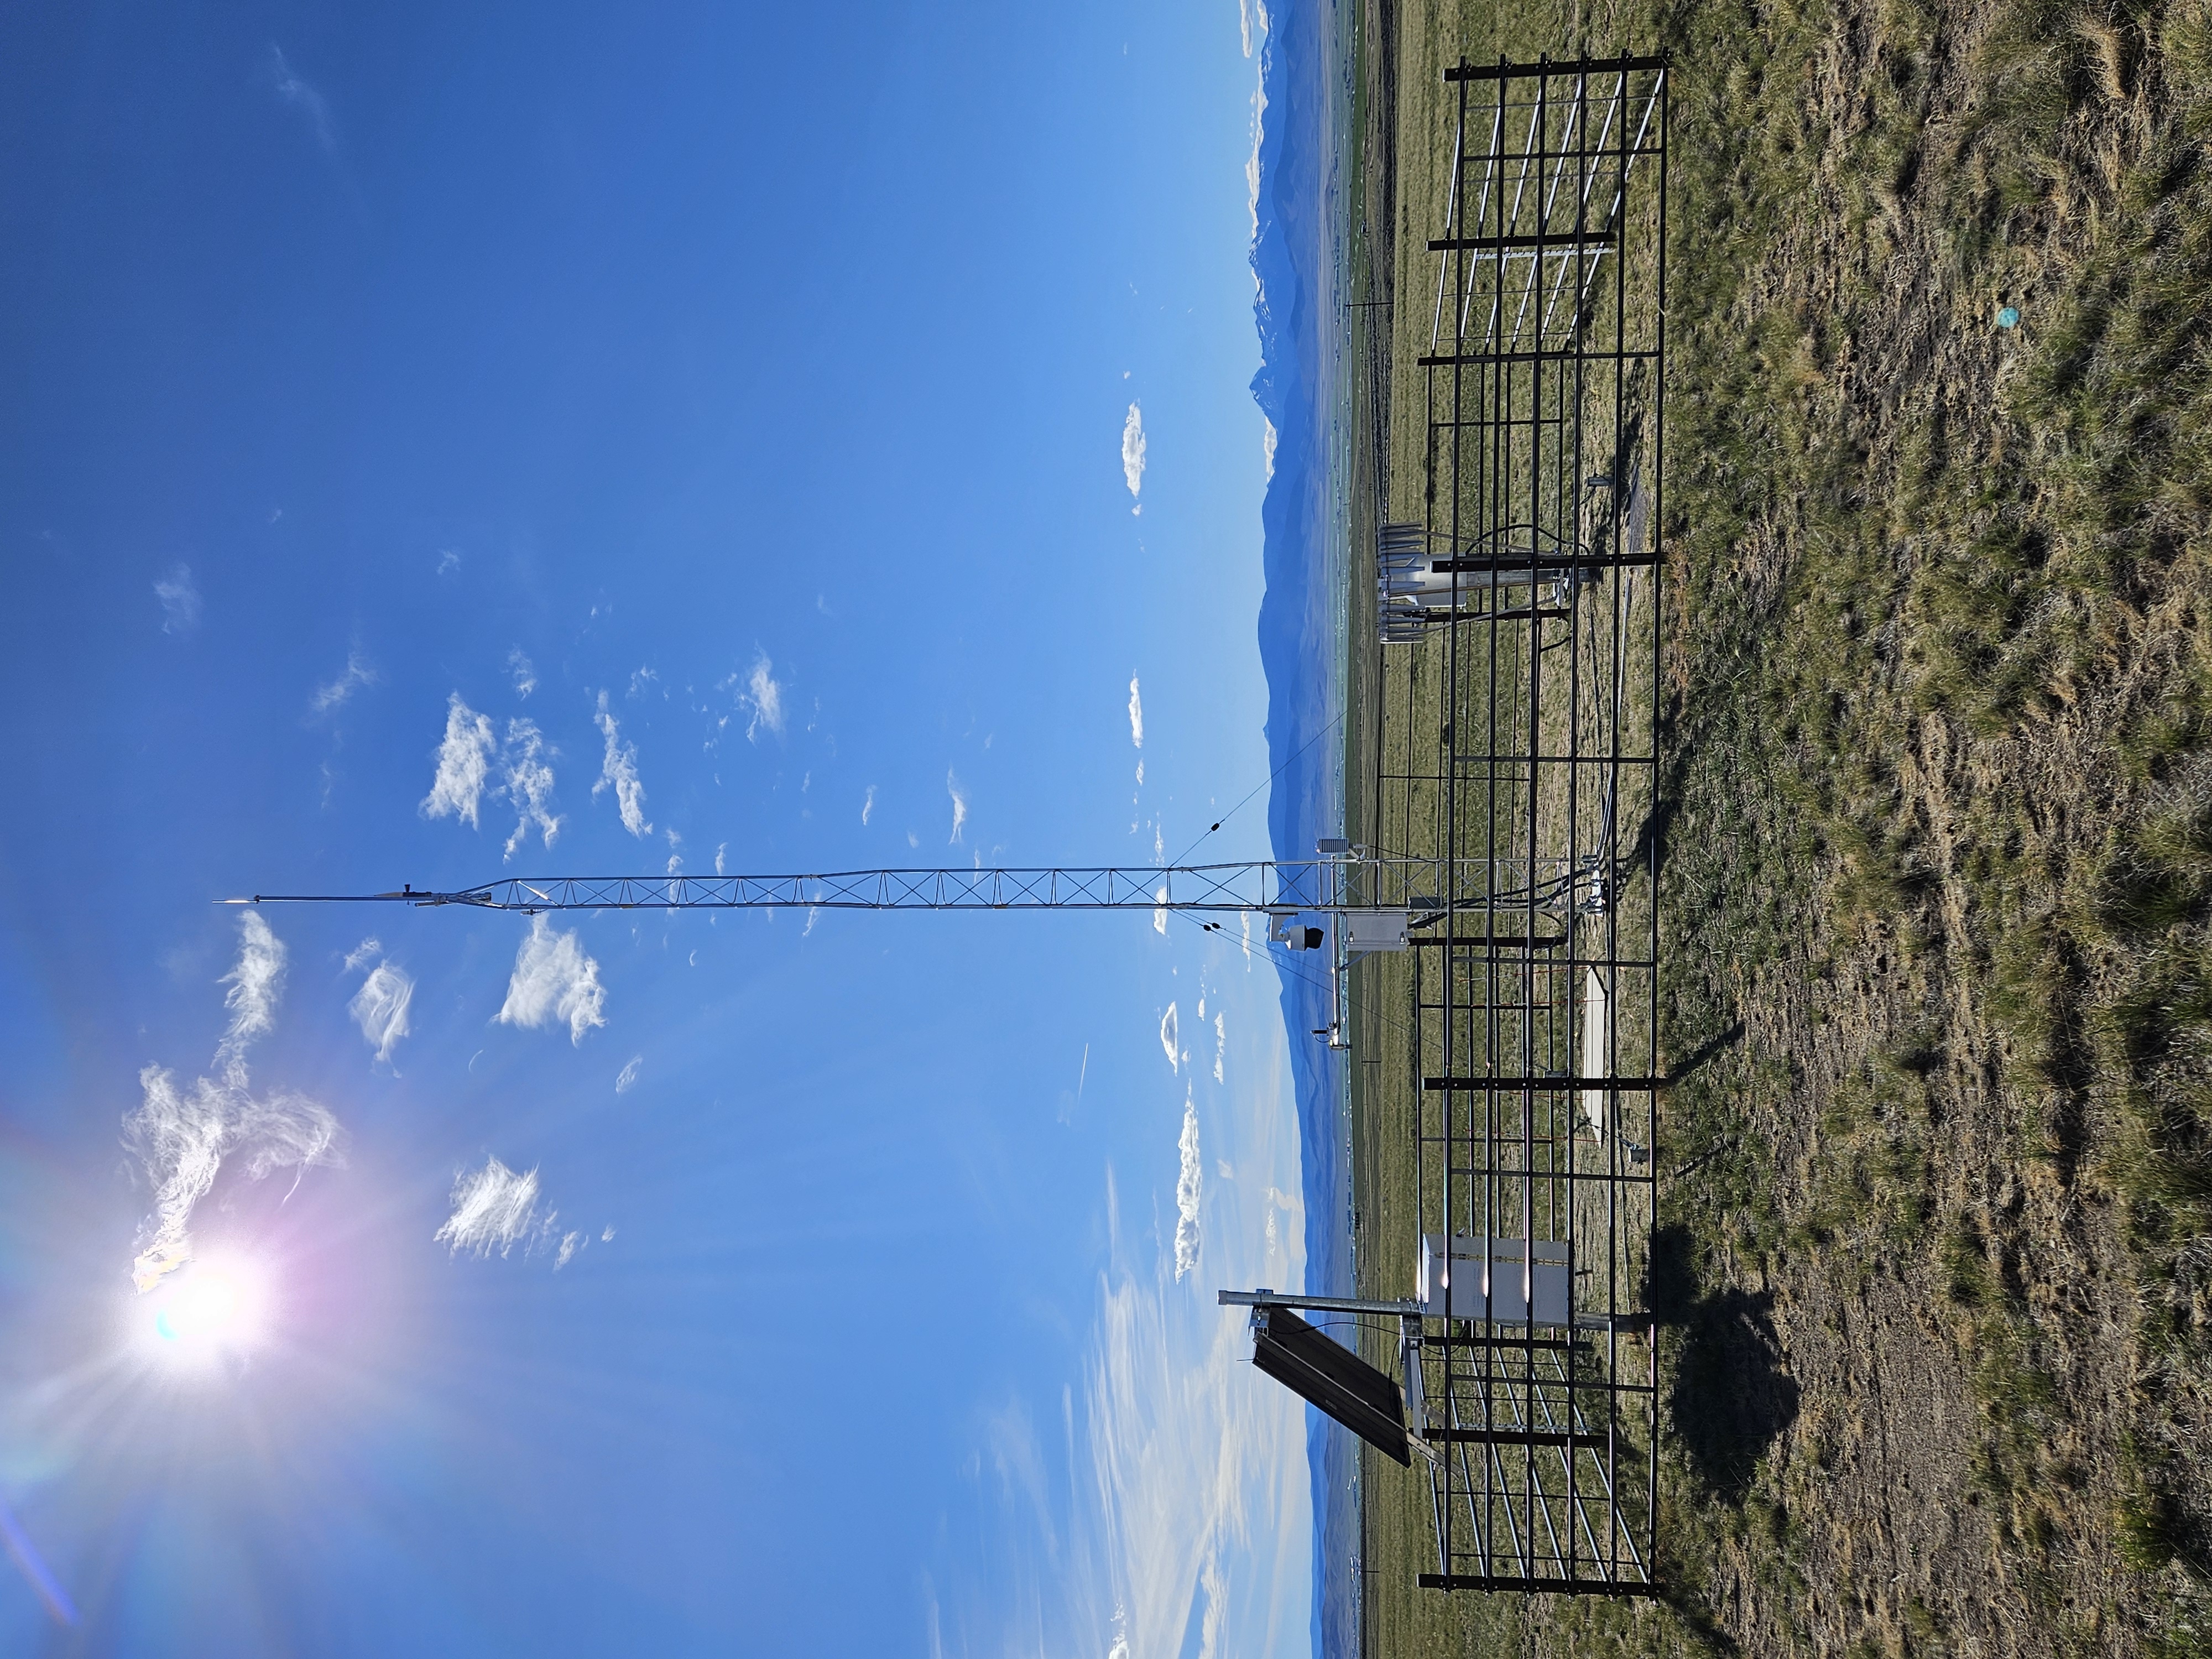 Dillon Mesonet Station, looking West.
Here’s what you’ll find in this June newsletter:
- New Mesonet Stations online.
- USDM Drought Status update.
- Soil Moisture conditions across the state.
MCO Update
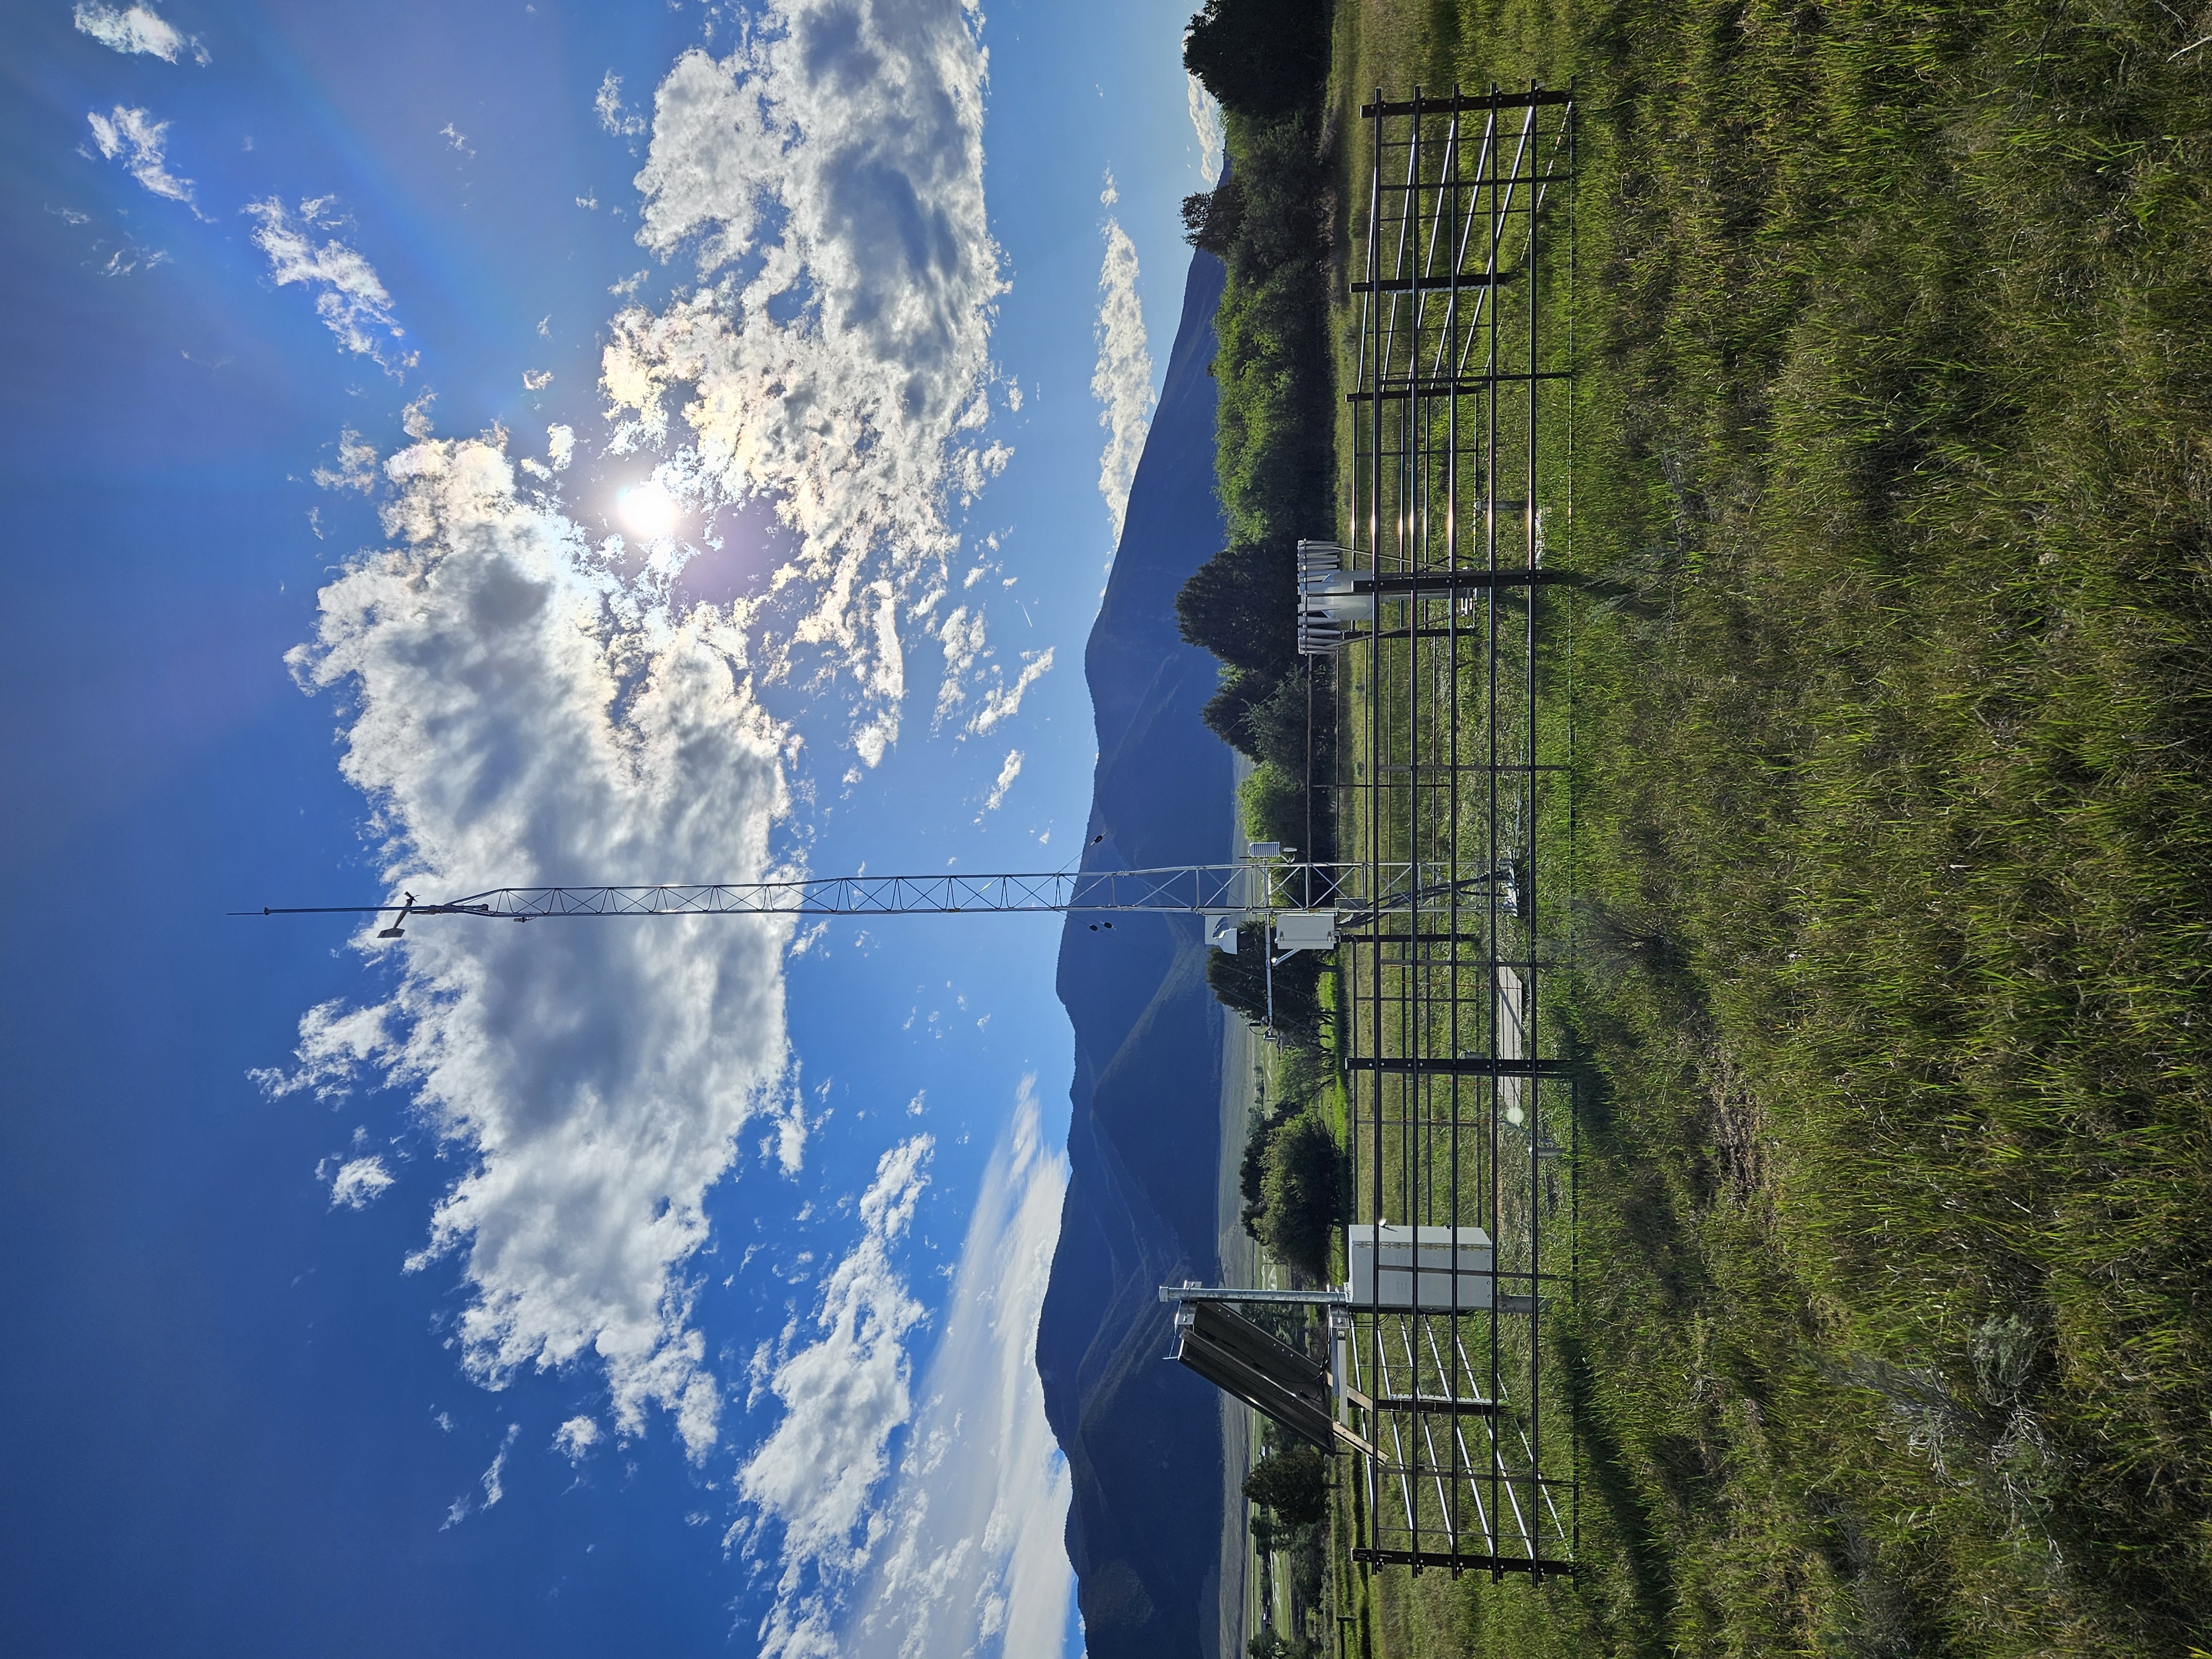 Laurin Mesonet Station, looking West.
- The first stations of the 2026 build season came online. Our crews installed Mesonet Stations in Dillon and Laurin. Check them out!
- The Faist Lab at the University of Montana and the Montana Climate Office are excited to announce the launch of EcoRestore Montana — a new web-based portal supporting native plant restoration for ecological resilience across Montana.
- Check out our social media!
In Brief
- Improved drought conditions for much of the northern part of the state.
- This month was cooler than average, with multiple beneficial precipitation events.
June Report
Temperature
Montana Temperature Deviation
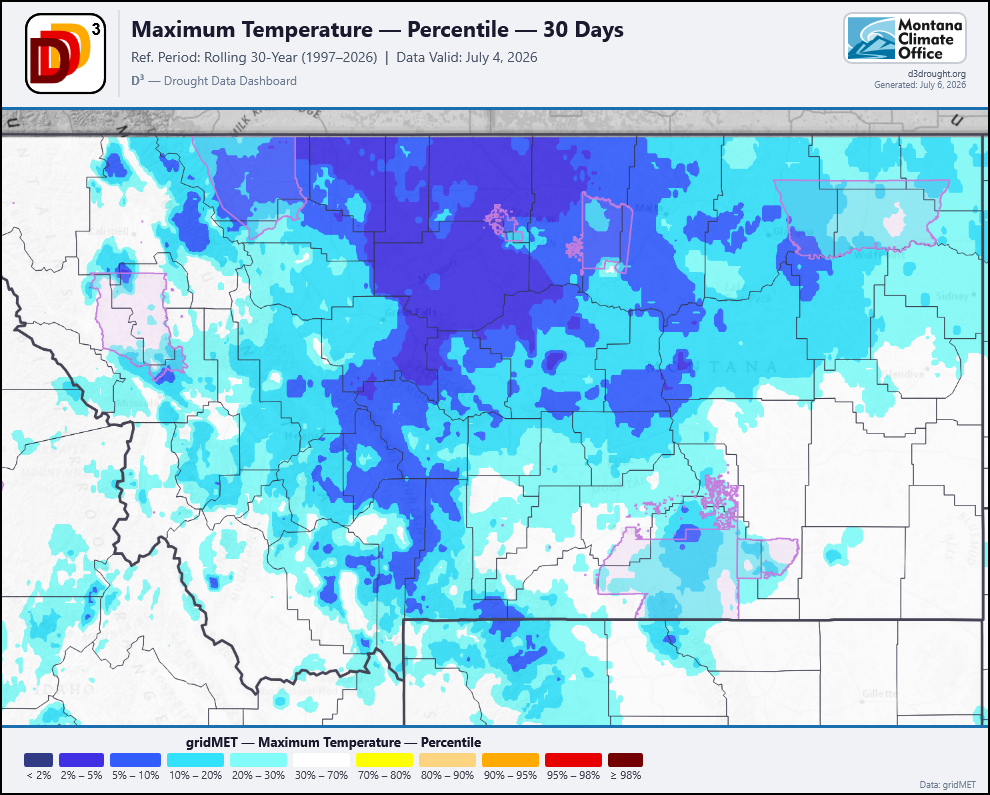 Source: Drought Data Dashboard.
The month of June had temperatures across the state ranging from normal to much cooler, all the way into the 2–10th percentiles below normal for this time of year. These low temperature percentiles could be beneficial as fire season begins to pick up across the West.
Seasonal Temperature Outlook
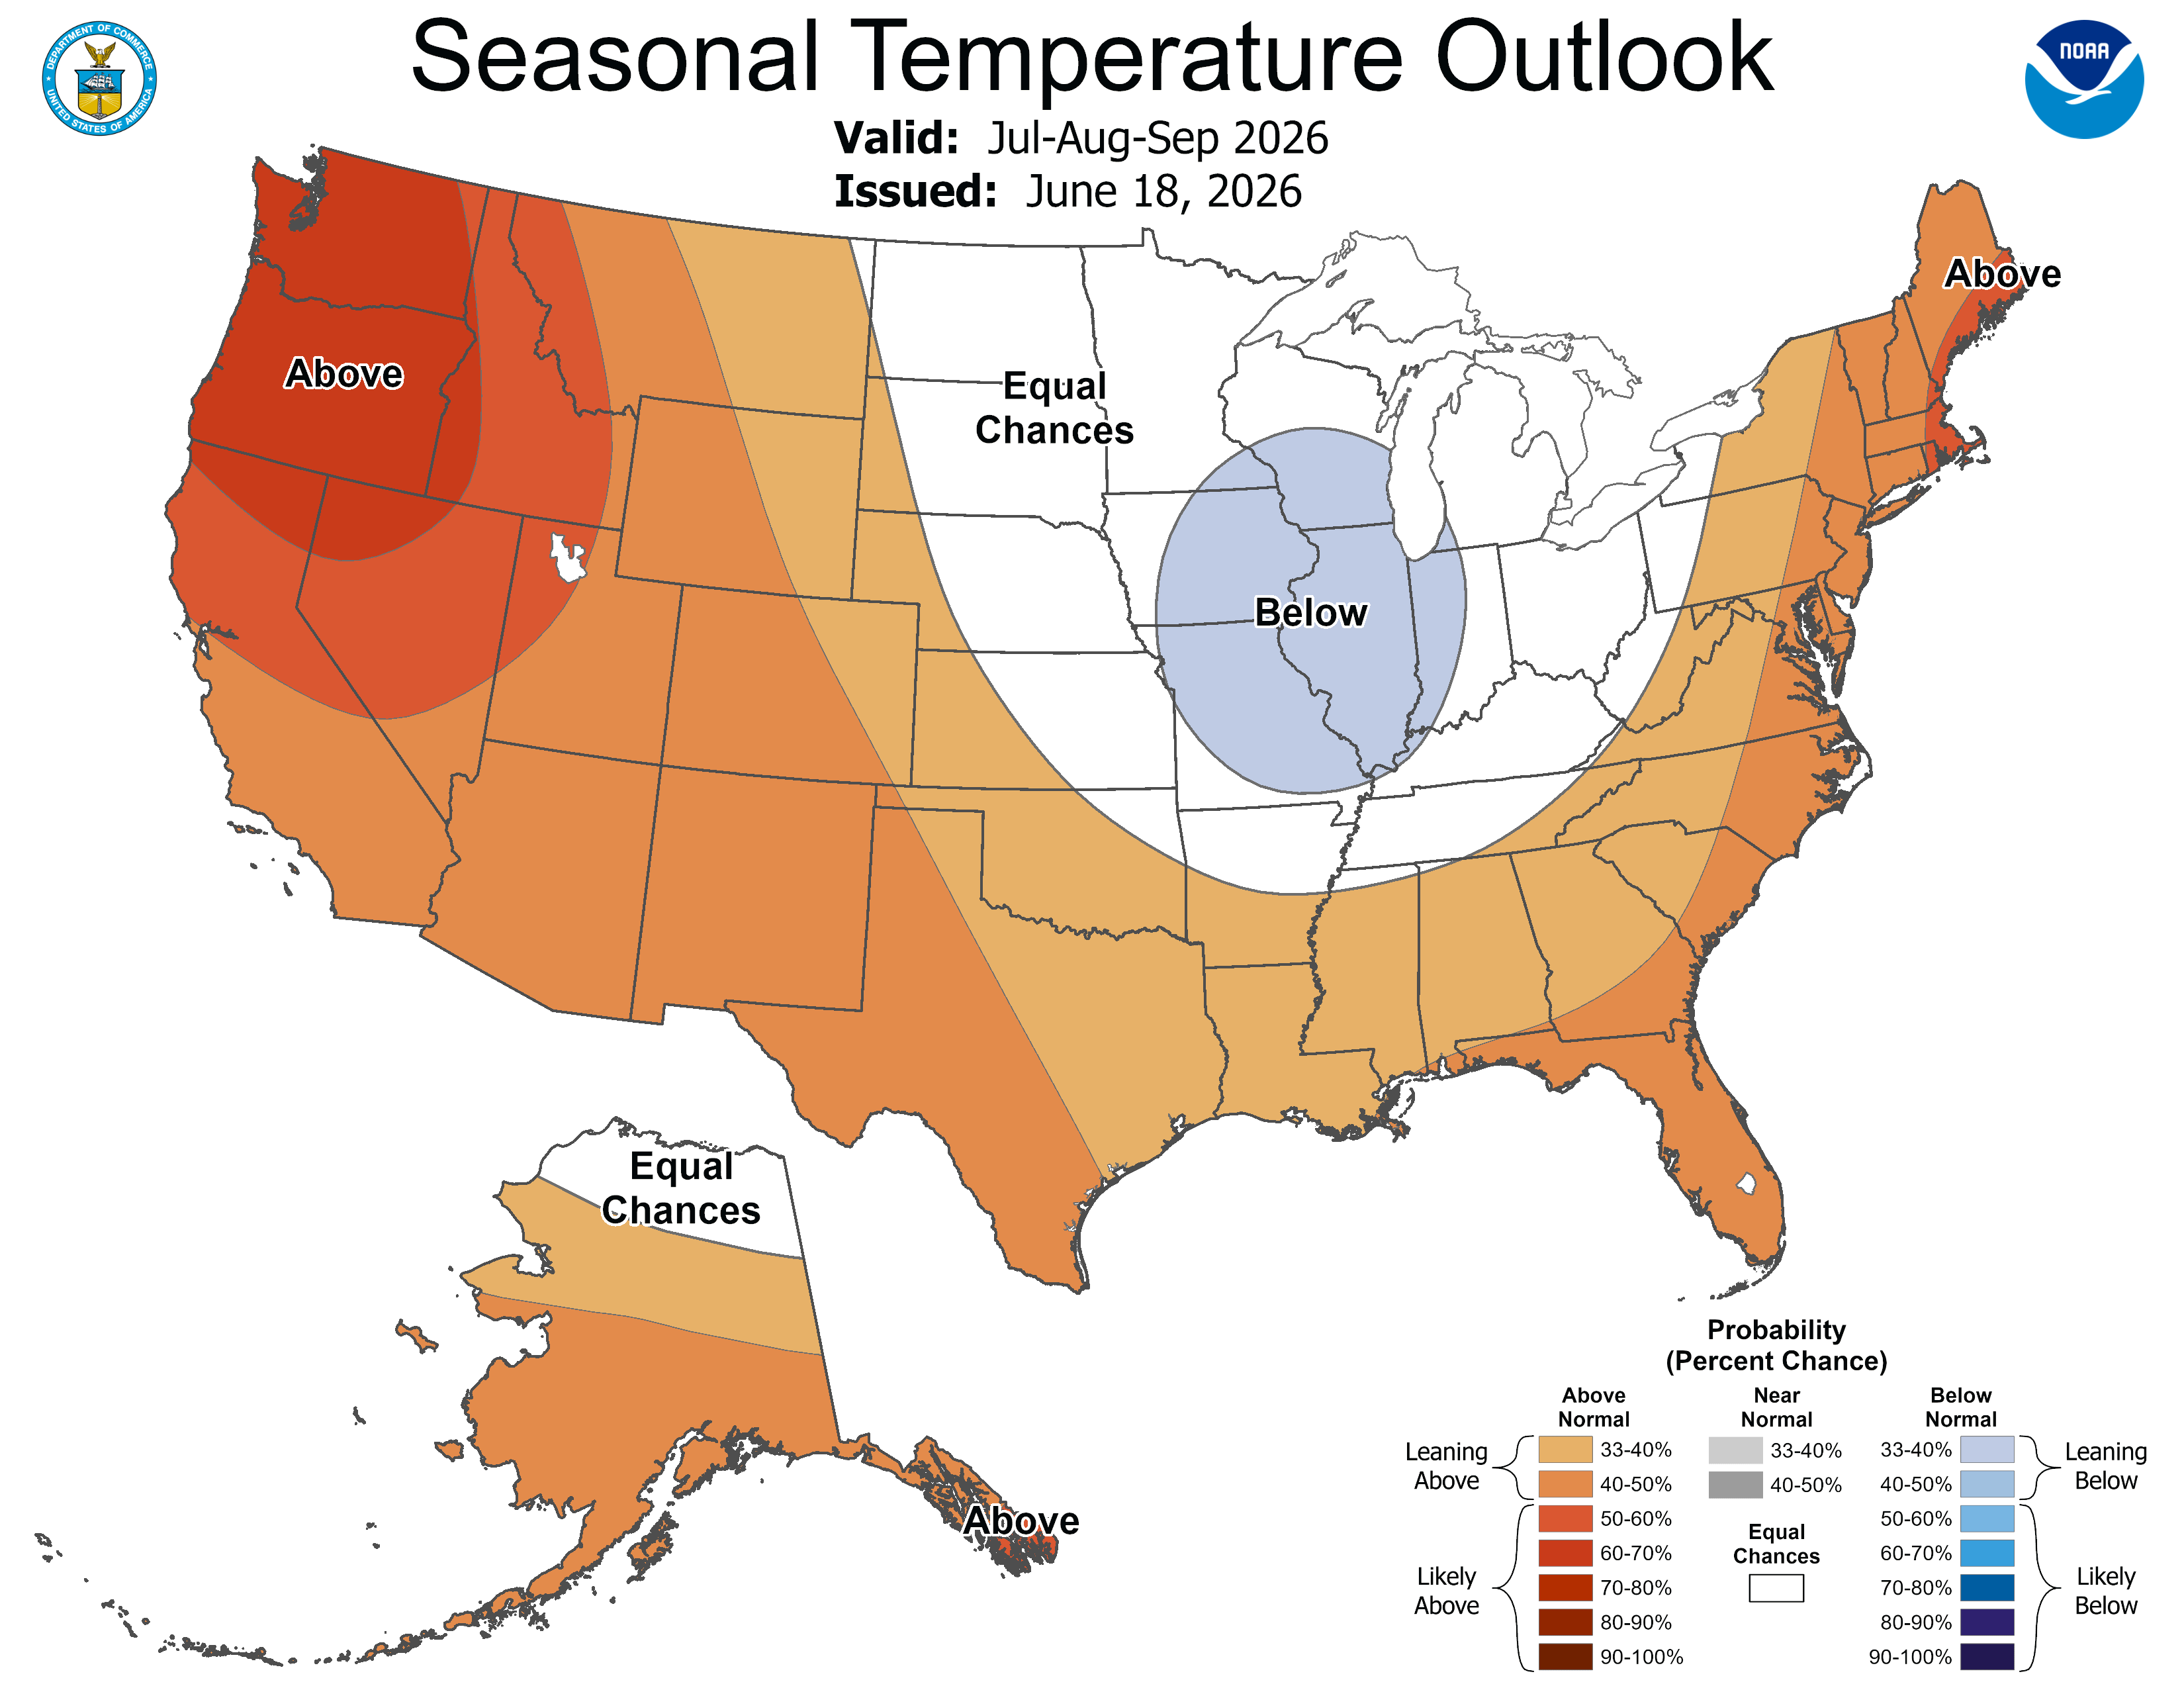 Source: Climate Prediction Center.
The summer seasonal temperature outlook probabilities indicate above-normal temperatures are likely (50–60%) in the west and leaning above-normal (33–40%) in the east.
Precipitation
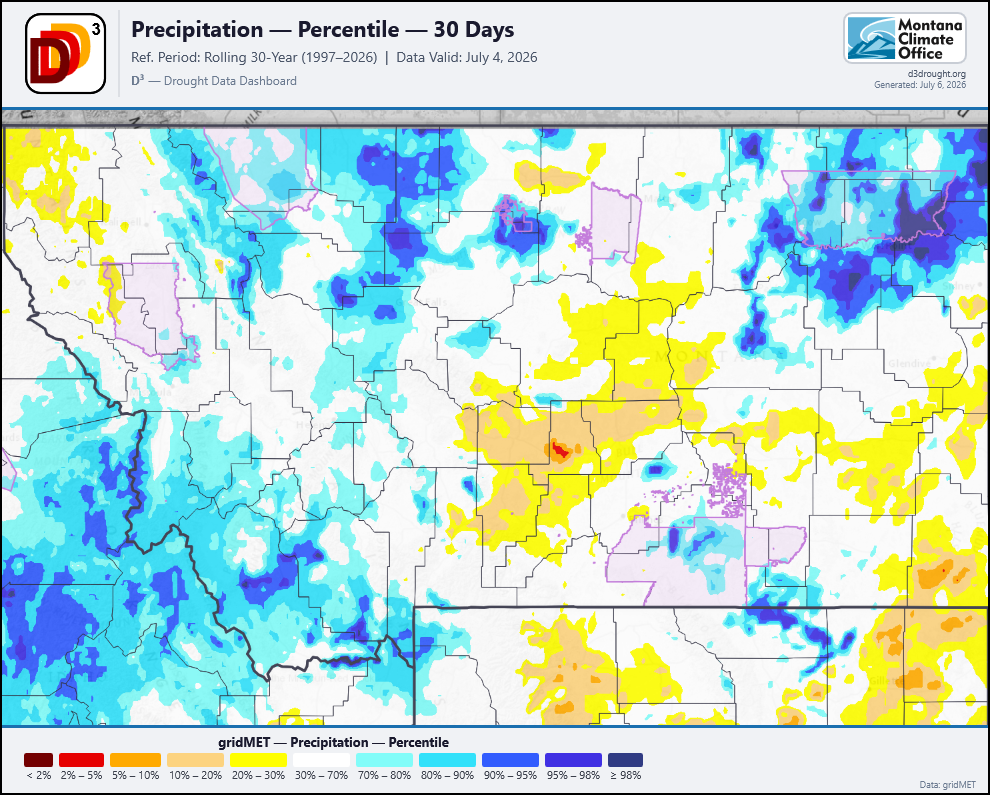 Source: Drought Data Dashboard.
June had precipitation events across the state that brought much needed, and at times significant precipitation to the driest parts of the state. The Southwest corner, which is in D4 Exceptional drought, and the Northwest corner of Montana received beneficial soaking rain. This precipitation is potentially a good buffer for wildfire season, as it begins to pick up.
Seasonal Precipitation Outlook
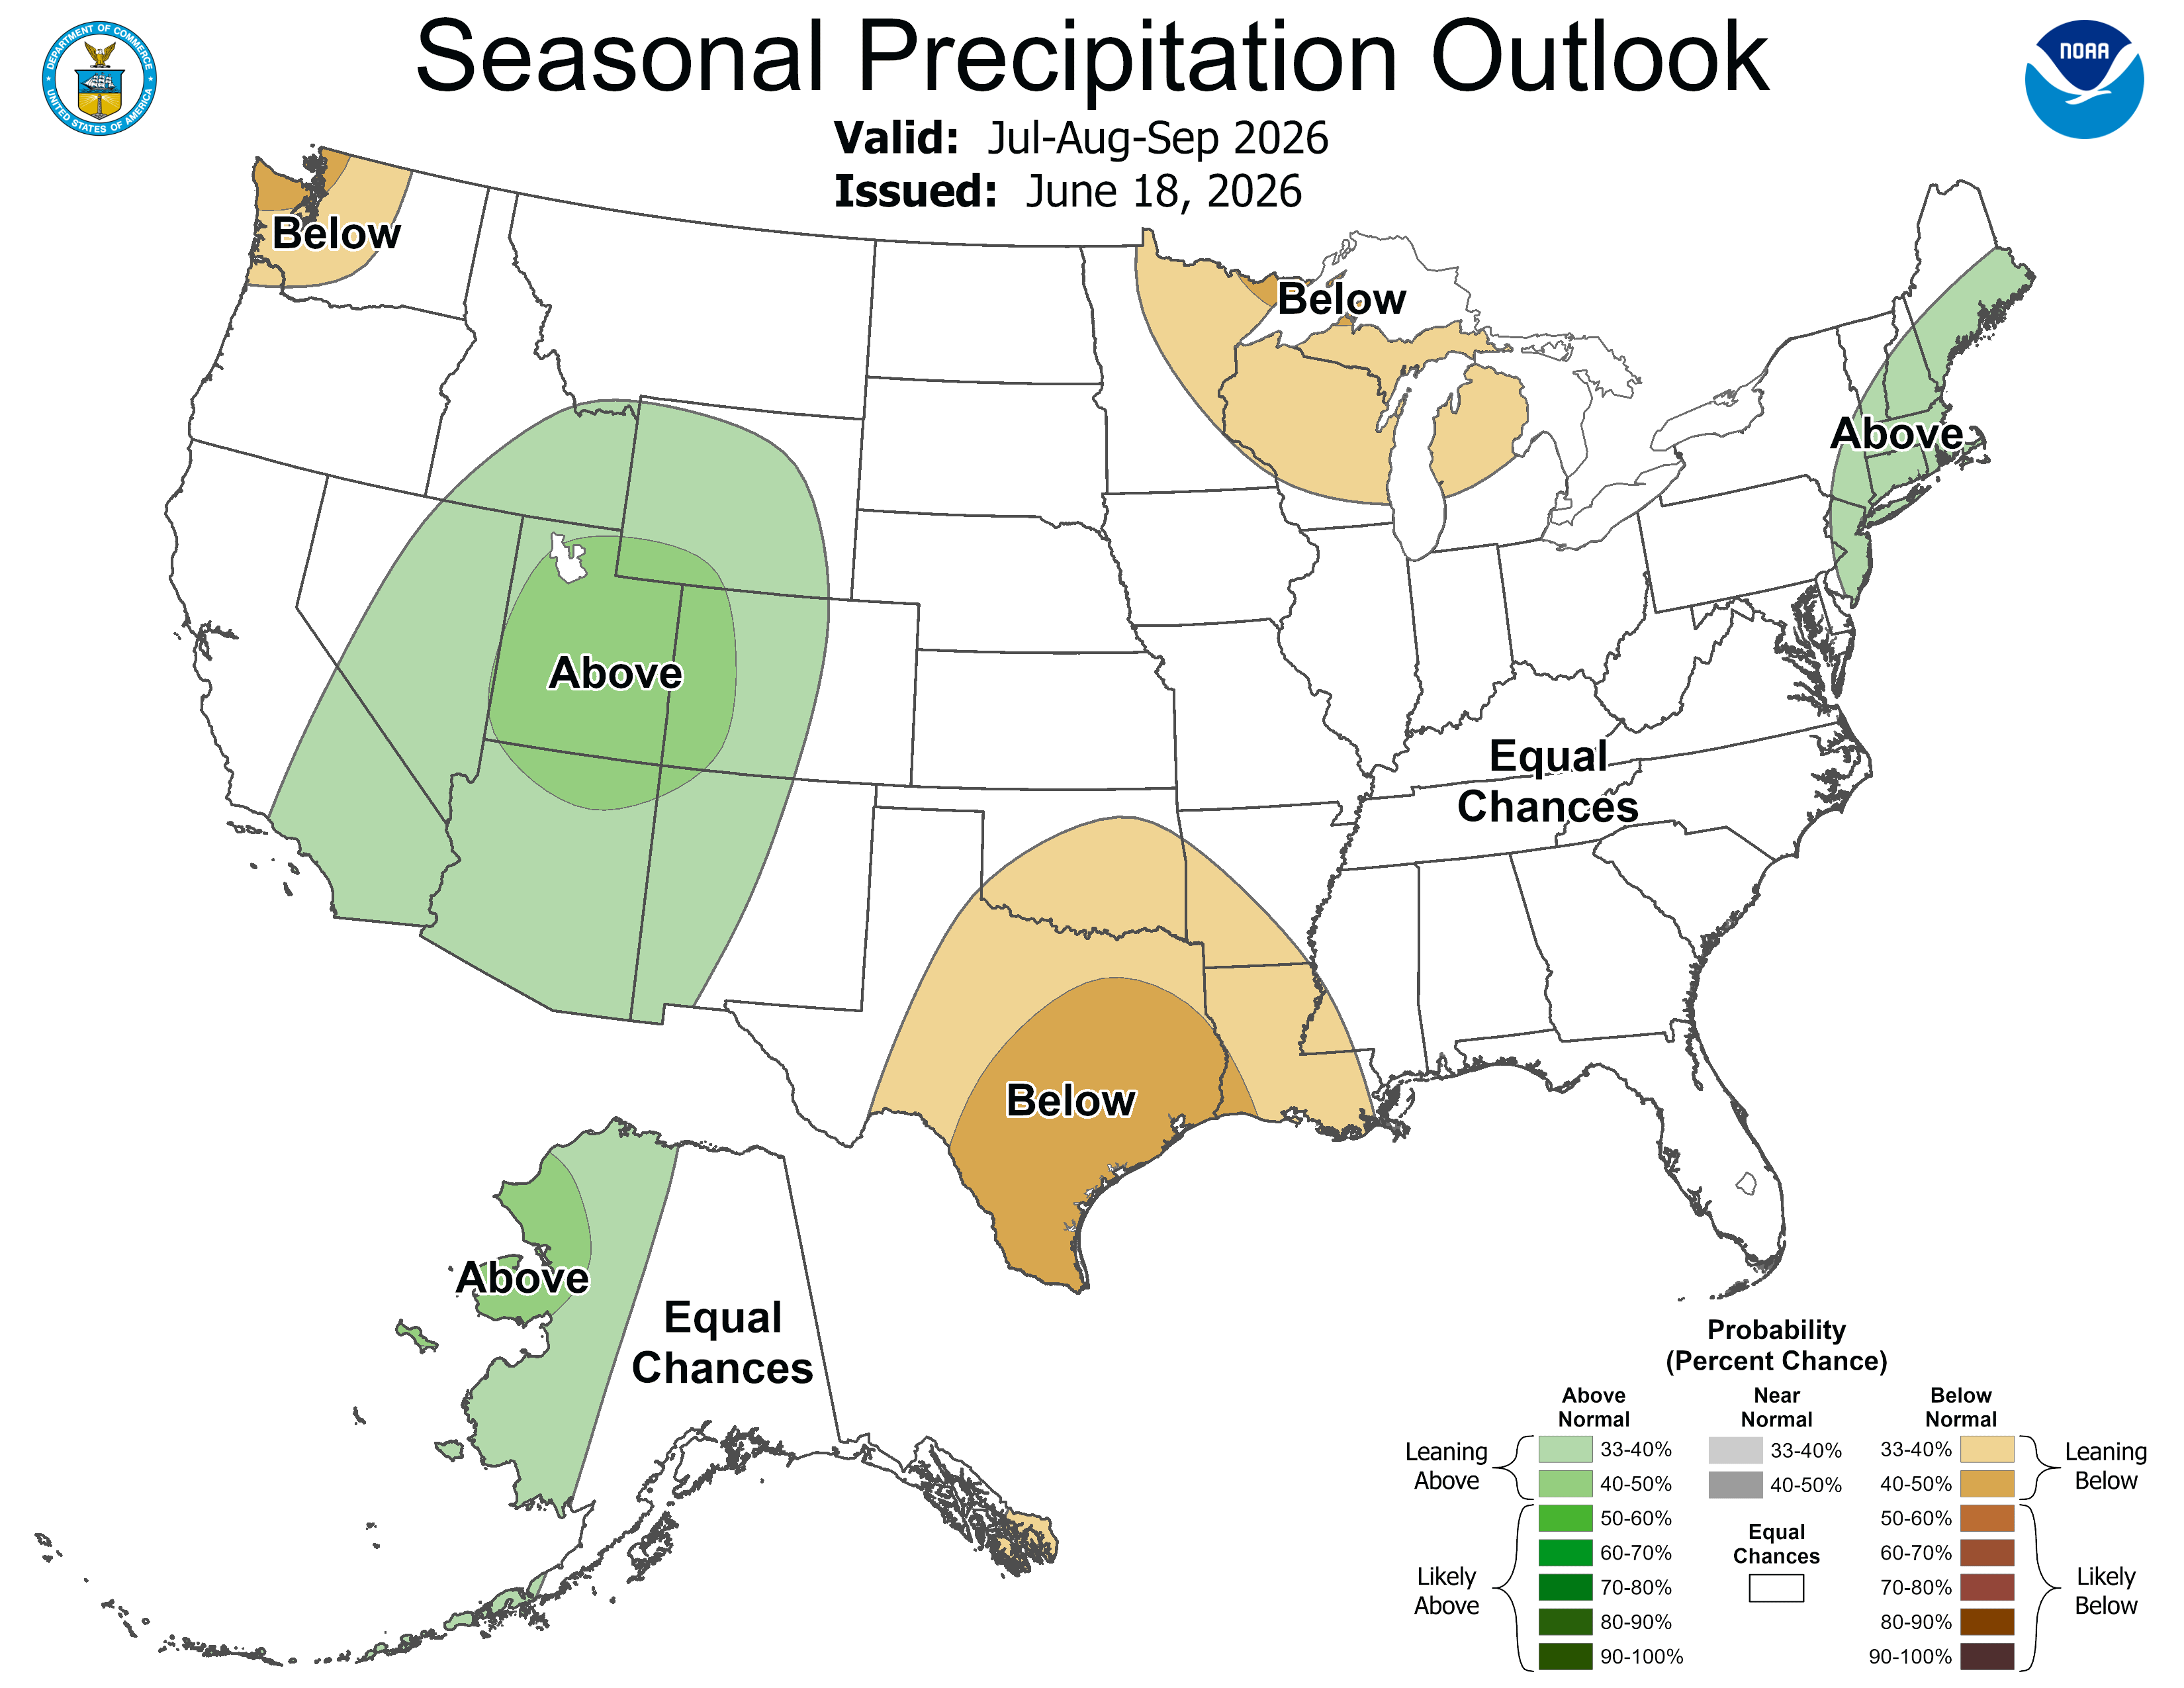 Source: NOAA
The July, August, and September precipitation outlook is giving an equal chance of precipitation being above or below near normal amounts for the rest of the summer.
Drought
June USDM Status
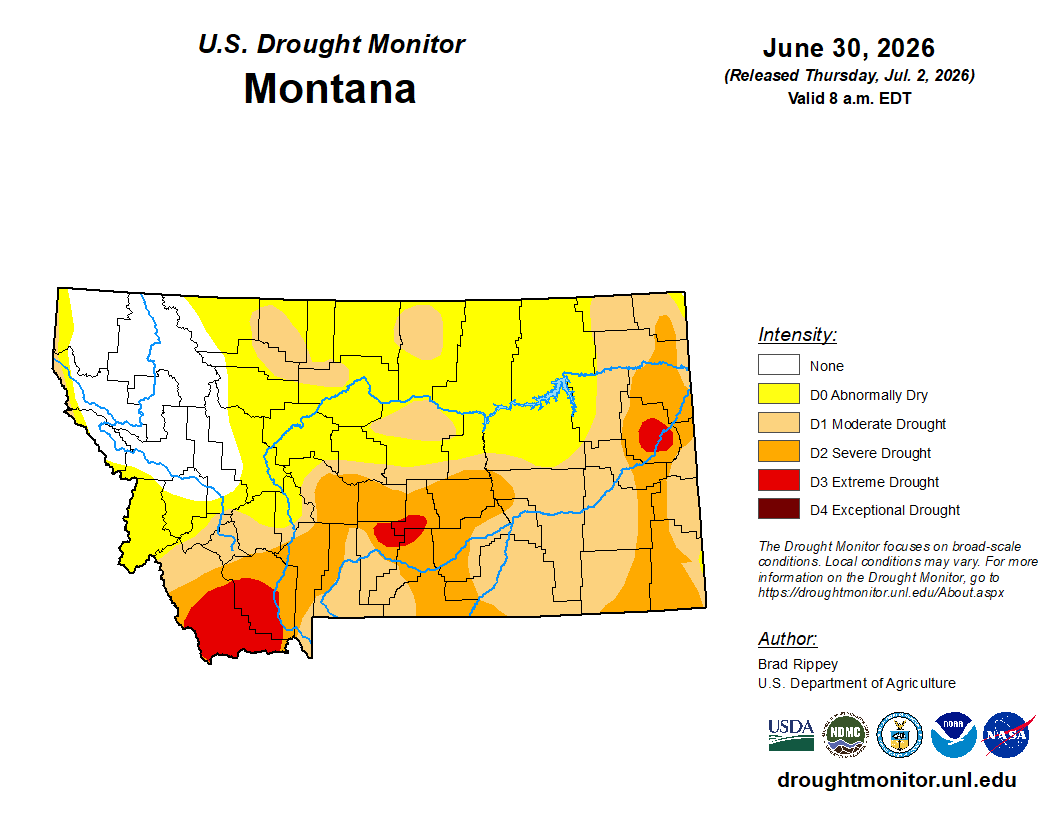 Source: USDM Montana Map.
The US Drought Monitor released their latest Map for June on the 30th. This map has most of the northern part of the state out of all three drought classes and into abnormally dry conditions, as a result of the wetting rain events that we had this month. Extreme drought was removed from Glacier, Toole, Pondera, and Choteau counties. In the eastern side of Montana, Richland County was removed from extreme drought status.
USDM 4 Week Class Change
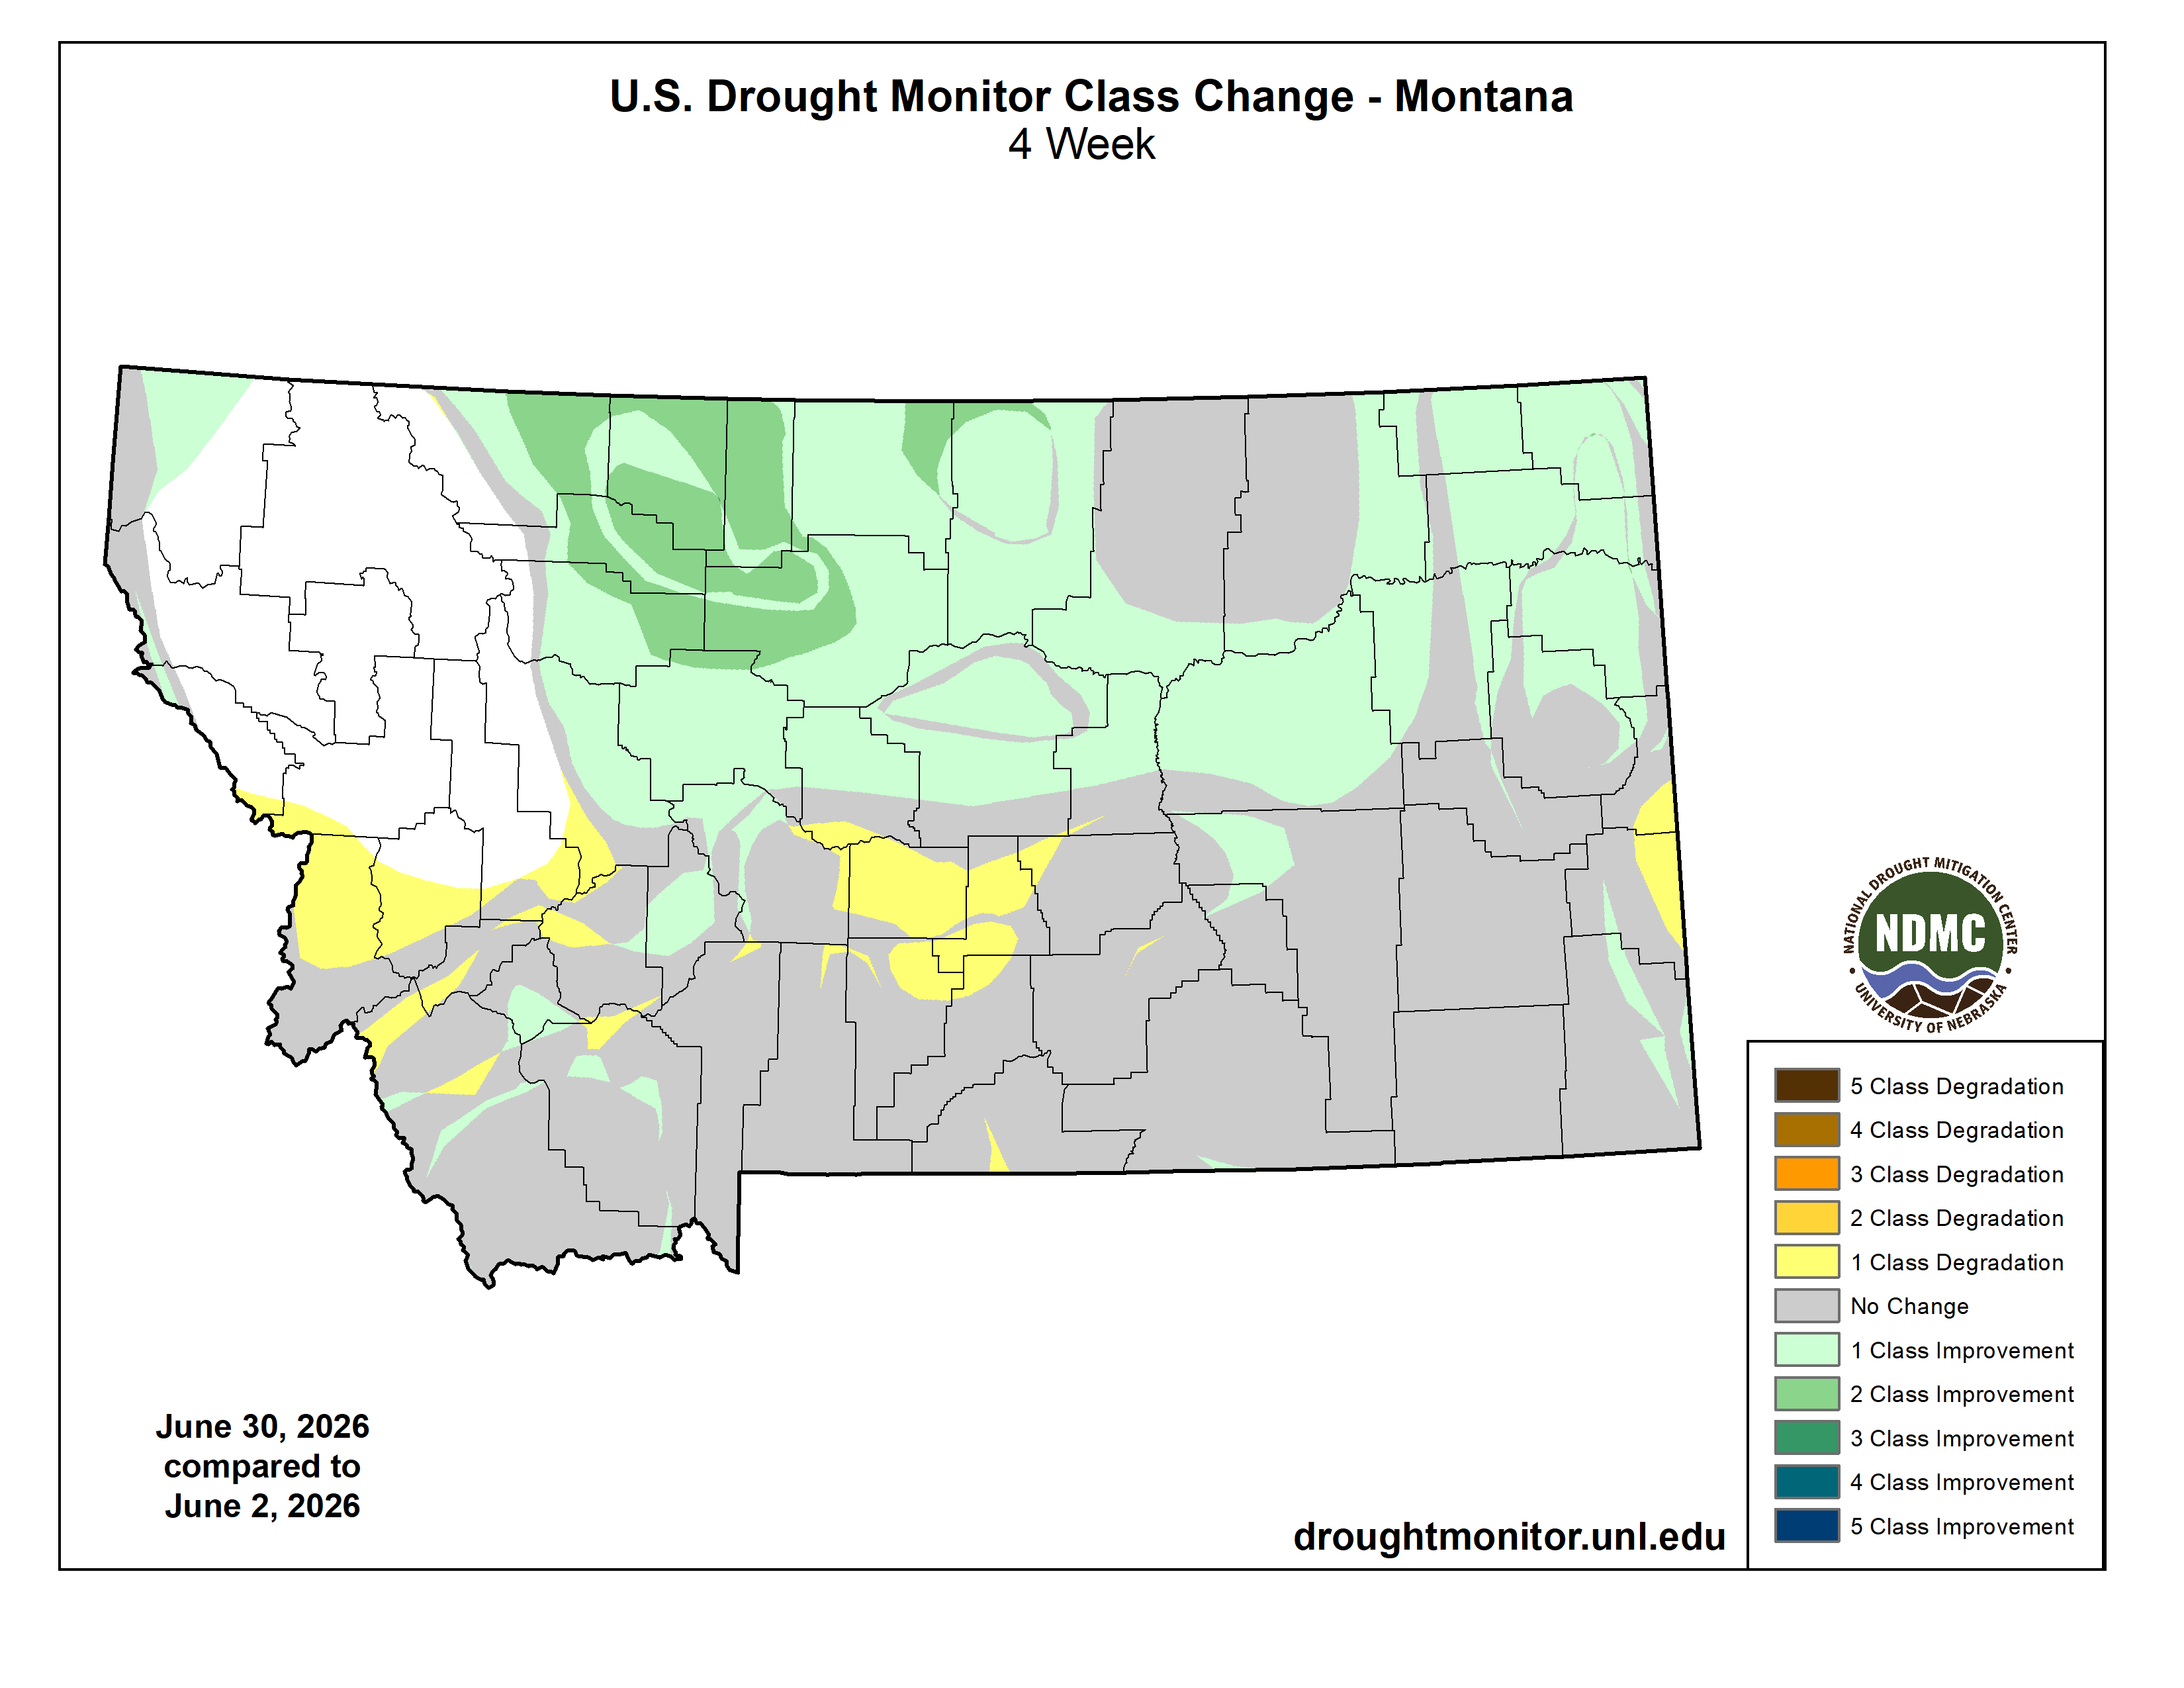 Source: Four-week Change Map.
June has been a good month for drought status improvement, with most of the central part of the state moving up 1 class, and localized areas east of the Rockies showing 2-class improvements.
Wheatland County and Ravalli County have shown 1-class degradation, and the counties surrounding Golden Valley County are areas that have shown a class degradation from severe drought to exceptional drought.
Seasonal Drought Outlook (JAS)
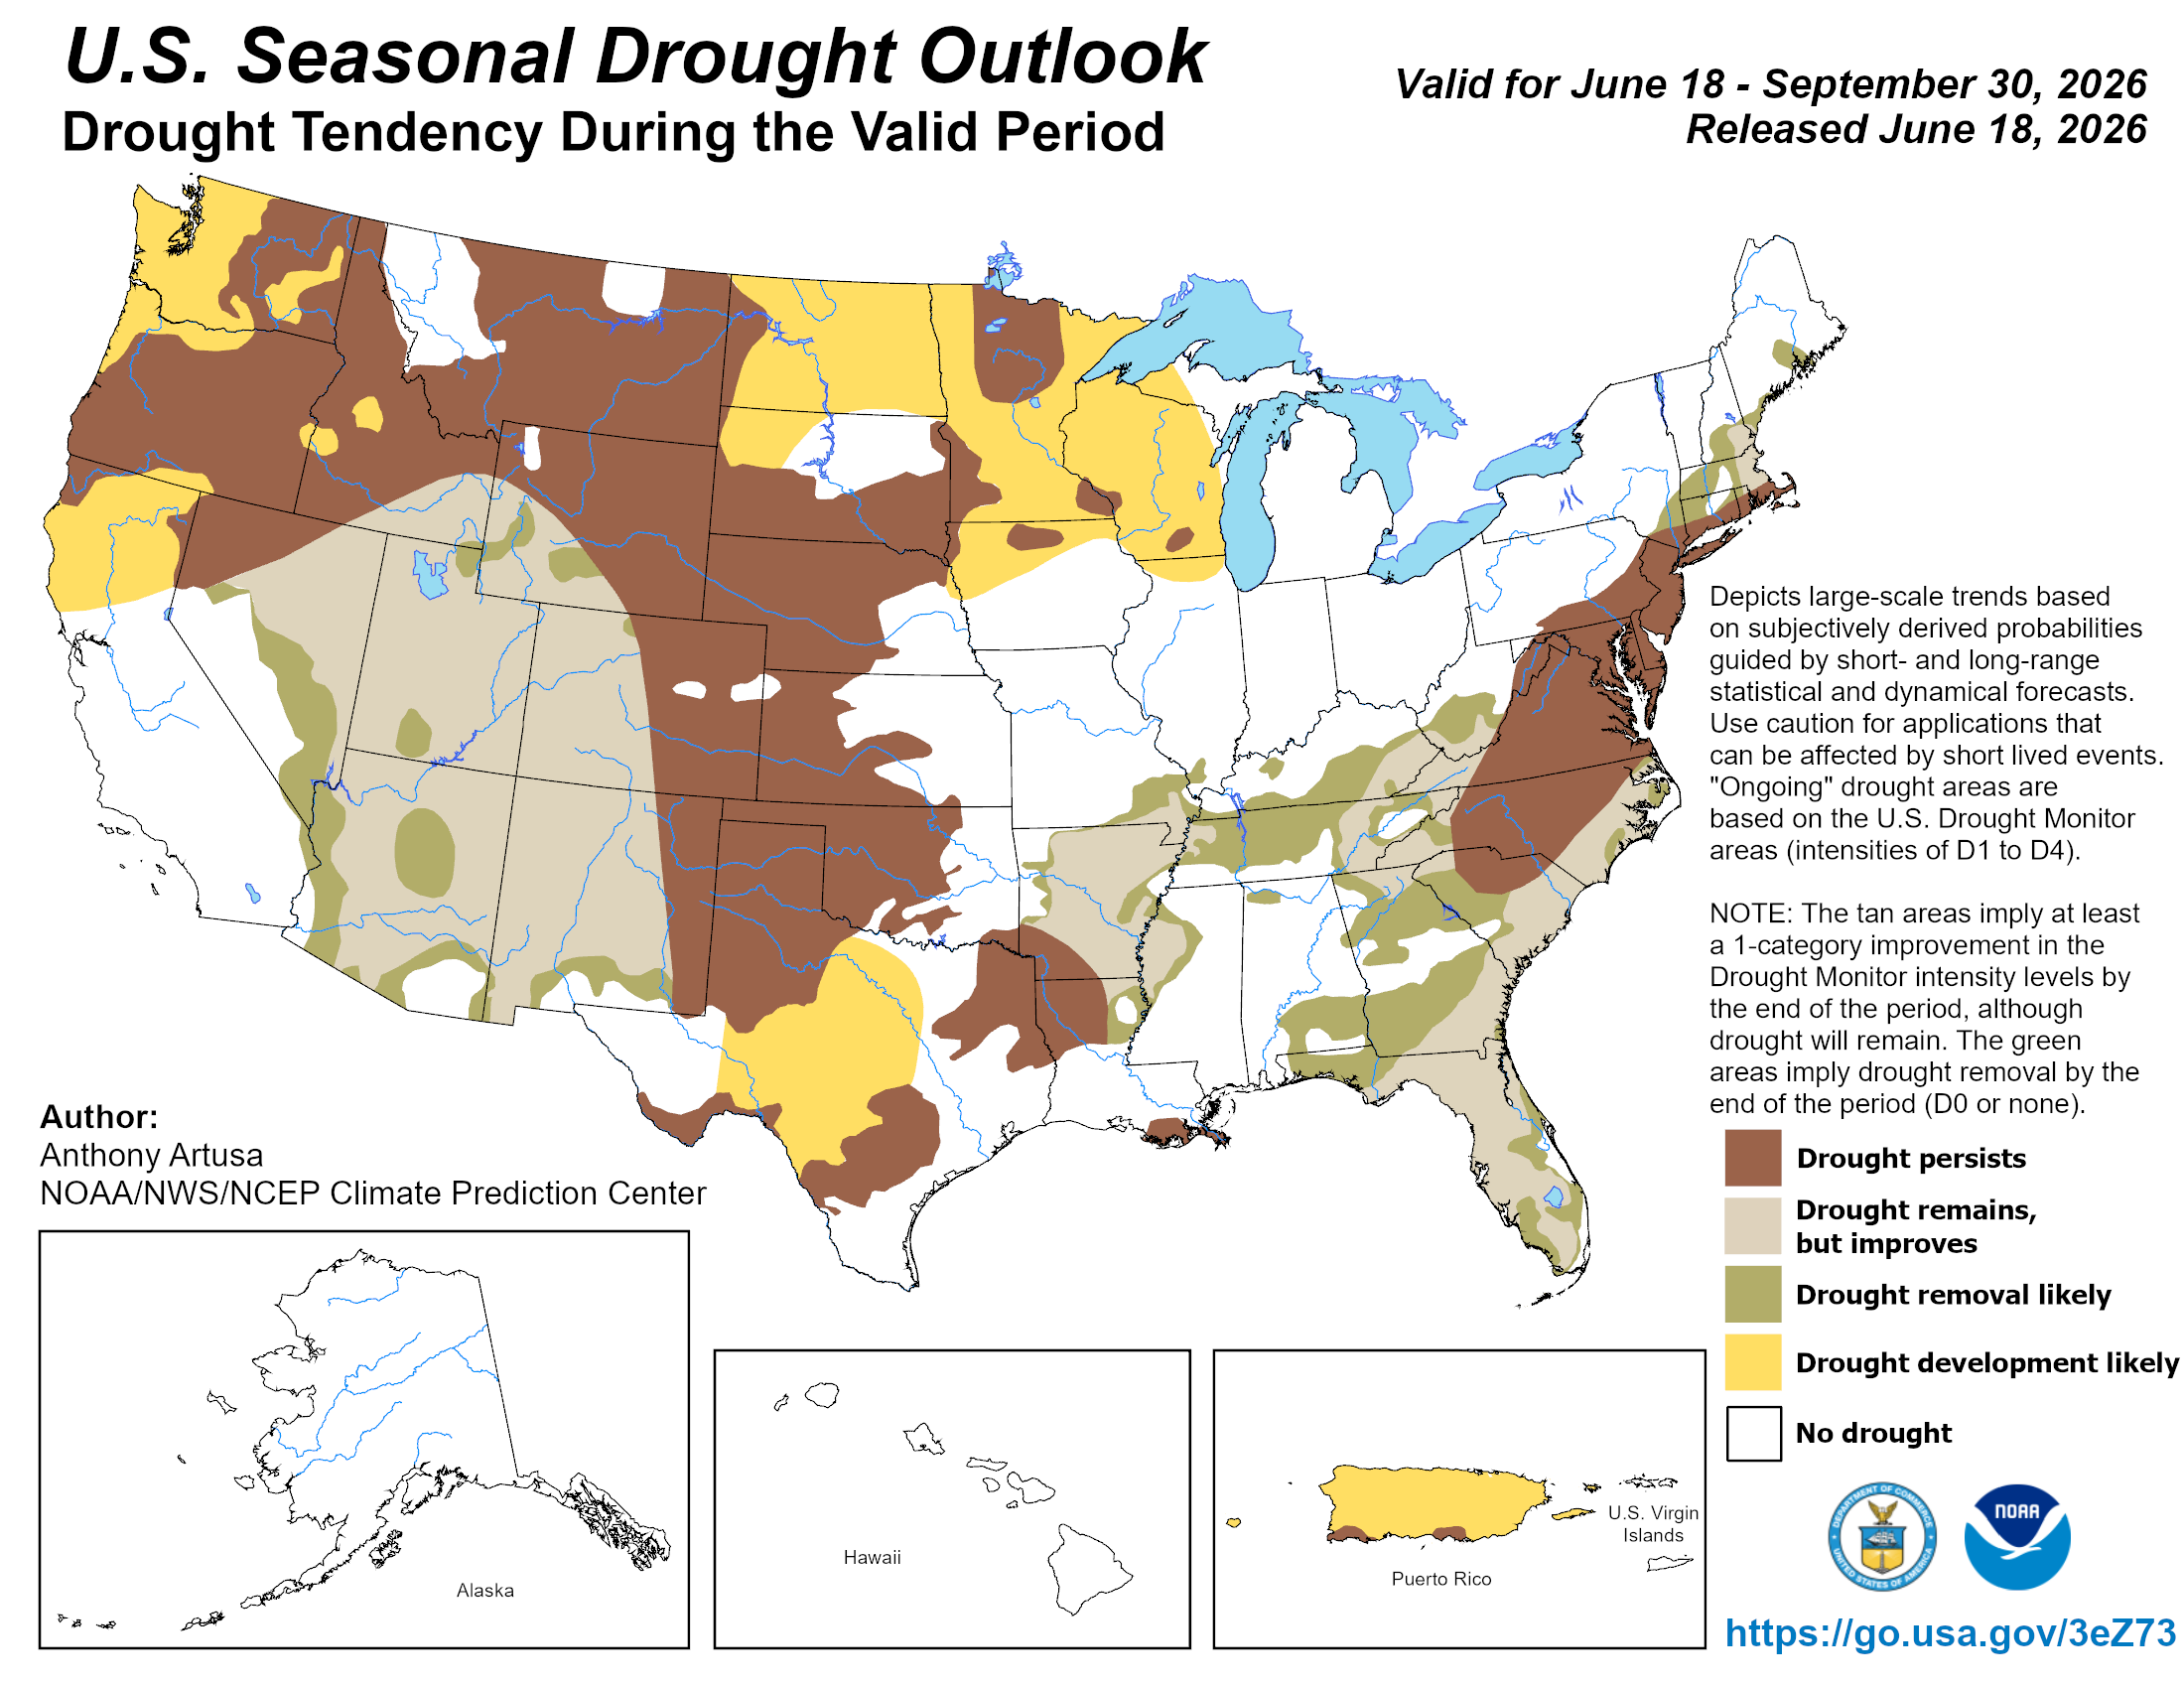 Source: NOAA Drought Outlook Map.
The Seasonal Drought Outlook predicts that most of the state will have drought persist, with no drought in the northwestern part of the state and in the area of Valley County.
Soil Moisture
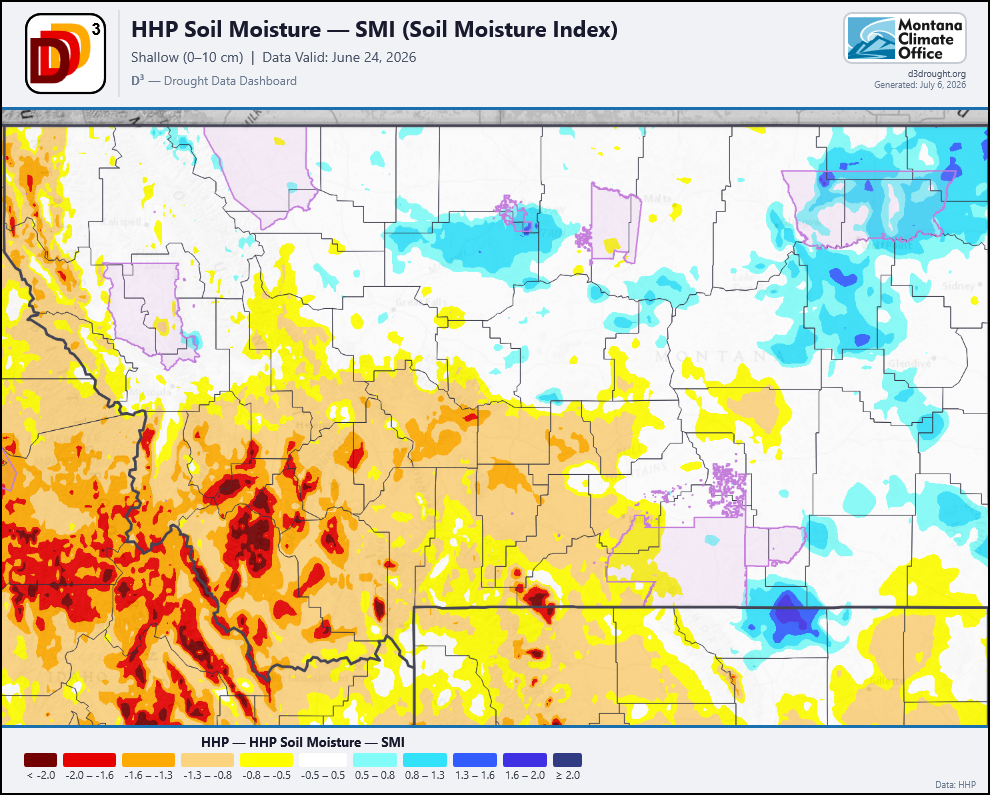 Source: Drought Data Dashboard.
Soil Moisture at shallow depths (0–10 cm) has reflected the drier conditions that persisted for most of the southwestern corner of the state for most of the month. Beneficial rains began to improve conditions in the northeastern corner, by the 25th of June.
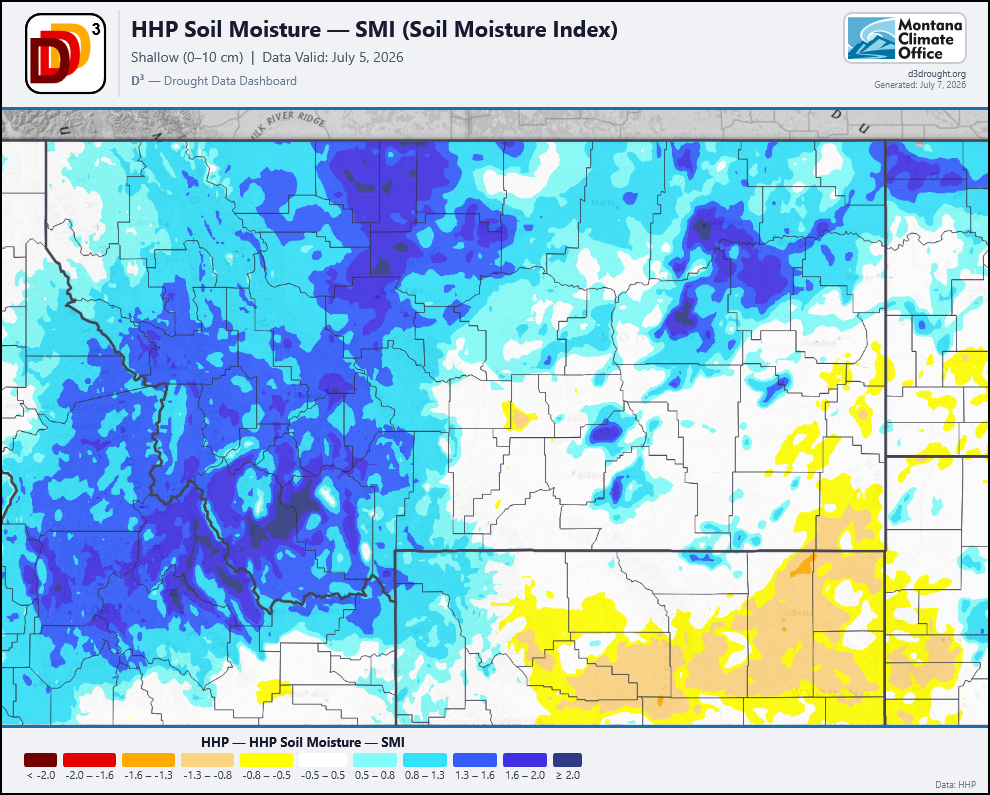 HHP Soil Moisture: July 5th.
After the significant rain events that moved through the state at the end of June, by July 5th, large swaths of the state has shallow (0–10cm) soil moisture percentiles above 0.5, all the way above 2.0 in Madison and Beaverhead Counties.
ENSO
Source: Climate Prediction Center.
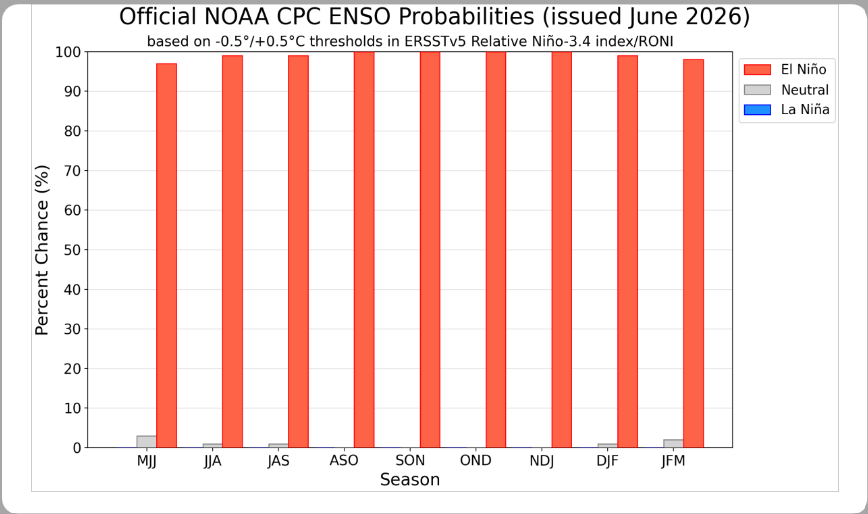 Source: Climate Prediction Center.
ENSO probabilities indicate that we are well into El Niño conditions and will remain for the rest of the year.
Reference
 Weather and Climate — The difference between weather and climate is timescale. Weather is the day-to-day interaction of factors like temperature, humidity, precipitation, cloudiness, visibility, and wind. To understand climate at a given place requires looking at weather trends over relatively long periods of time—months, years, and decades. In addition to studying weather, scientists examine climate trends or cycles of variability to understand the bigger picture of long-term changes.
 Temperature and Precipitation — Throughout this newsletter, we report past temperature and precipitation data derived directly from the GridMET daily 4-km-gridded meteorological dataset from the University of Idaho. Temperature data are reported as seasonal averages; precipitation data are reported as seasonal total precipitation. Our three-month temperature and precipitation forecasts come from NOAA’s Climate Prediction Center.
Climatologists use the term “normal” to compare current conditions or forecasts, such as temperature or precipitation, to the past. Here, the normal value is the statistical mean (the average) for a given measurement in a specific place during a specific period of time. Climatologists use the most recent 30-year period, rounded to the nearest decade, to define normal in North America: 1981–2010. The goal is to look far enough back in time to capture variation in weather patterns, but not so far as to be irrelevant to recent conditions. In 2026, we will start using the 1996–2026 period.
 La Niña/El Niño — El Niño and La Niña are the warm and cool phases of a recurring climate pattern across the tropical Pacific, the El Niño Southern Oscillation (ENSO). When ENSO is between warm and cool phases, conditions are called ENSO Neutral. ENSO is one of several global climate phenomena that affect Montana’s weather patterns, and ENSO conditions often guide seasonal climate projections for Montana. Current ENSO conditions and up-to-date projections are available on NOAA’s ENSO website.
 Snow Water Equivalent (SWE) — SWE is the amount of water contained within the snowpack. It can be thought of as the depth of water that would theoretically result if you melted the entire snowpack. SWE is measured across the West by the USDA Natural Resources Conservation Service’s SNOTEL network of snow monitoring stations. The SWE percent of normal represents the current snow water equivalent found at selected SNOTEL sites in the basin compared to the normal value for those sites from 1981–2010.
 Root Zone Soil Wetness — Root Zone Soil Wetness is a measure of how much water has saturated the soil. More specifically, it’s the relative saturation between completely dry (indicated by a 0) and completely saturated (indicated by a 1) between 0 and 100 cm depth. In the maps in this newsletter, soil saturation comes from NASA’s Soil Moisture Active Passive (SMAP) satellite program “SPL4SMGP” data product. Soil moisture is mapped using a combination of radar and radiometer measurements from space and surface observations at an approximately 9-km spatial resolution.